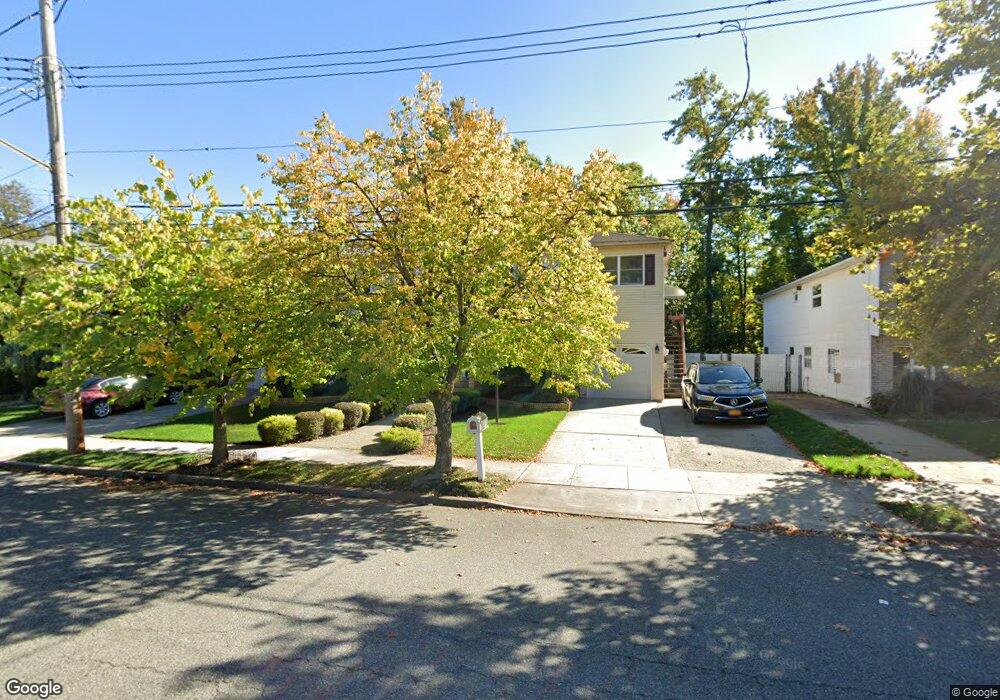
70 N Railroad St Staten Island, NY 10312
Annadale NeighborhoodEstimated Value: $1,118,141 - $1,573,000
4
Beds
3
Baths
2,880
Sq Ft
$459/Sq Ft
Est. Value
About This Home
This home is located at 70 N Railroad St, Staten Island, NY 10312 and is currently estimated at $1,321,785, approximately $458 per square foot. 70 N Railroad St is a home located in Richmond County with nearby schools including P.S. 36 - J.C. Drumgoole, I.S. 007 Elias Bernstein, and Tottenville High School.
Ownership History
Date
Name
Owned For
Owner Type
Purchase Details
Closed on
Apr 7, 2025
Sold by
Benvenuto Joanne
Bought by
Frank And Joanne Benvenuto Irrevocable Trust and Benvenuto
Current Estimated Value
Purchase Details
Closed on
Nov 7, 2003
Sold by
Benvenuto Frank and Benvenuto Joanne
Bought by
Benvenuto Joanne
Home Financials for this Owner
Home Financials are based on the most recent Mortgage that was taken out on this home.
Original Mortgage
$100,000
Interest Rate
5.98%
Mortgage Type
Unknown
Purchase Details
Closed on
Feb 14, 2001
Sold by
Monitello Patrick and Monitello Doreen
Bought by
Benvenuto Frank and Benvenuto Joanne
Home Financials for this Owner
Home Financials are based on the most recent Mortgage that was taken out on this home.
Original Mortgage
$100,000
Interest Rate
7.01%
Create a Home Valuation Report for This Property
The Home Valuation Report is an in-depth analysis detailing your home's value as well as a comparison with similar homes in the area
Home Values in the Area
Average Home Value in this Area
Purchase History
| Date | Buyer | Sale Price | Title Company |
|---|---|---|---|
| Frank And Joanne Benvenuto Irrevocable Trust | -- | None Listed On Document | |
| Benvenuto Joanne | -- | Fidelity National Title Ins | |
| Benvenuto Frank | $500,000 | -- |
Source: Public Records
Mortgage History
| Date | Status | Borrower | Loan Amount |
|---|---|---|---|
| Previous Owner | Benvenuto Joanne | $100,000 | |
| Previous Owner | Benvenuto Frank | $100,000 |
Source: Public Records
Tax History Compared to Growth
Tax History
| Year | Tax Paid | Tax Assessment Tax Assessment Total Assessment is a certain percentage of the fair market value that is determined by local assessors to be the total taxable value of land and additions on the property. | Land | Improvement |
|---|---|---|---|---|
| 2025 | $8,557 | $67,740 | $11,719 | $56,021 |
| 2024 | $8,661 | $65,880 | $11,368 | $54,512 |
| 2023 | $8,231 | $43,776 | $10,495 | $33,281 |
| 2022 | $8,080 | $61,260 | $16,140 | $45,120 |
| 2021 | $8,432 | $54,240 | $16,140 | $38,100 |
| 2020 | $8,017 | $58,380 | $16,140 | $42,240 |
| 2019 | $8,877 | $51,300 | $16,140 | $35,160 |
| 2018 | $6,777 | $36,480 | $16,140 | $20,340 |
| 2017 | $7,867 | $41,760 | $16,140 | $25,620 |
| 2016 | $7,823 | $42,240 | $16,140 | $26,100 |
| 2015 | $7,594 | $41,580 | $13,440 | $28,140 |
| 2014 | $7,594 | $41,160 | $13,440 | $27,720 |
Source: Public Records
Map
Nearby Homes
- 338 Edgegrove Ave
- 26 Buffington Ave
- 382 Edgegrove Ave
- 2 Radnor St
- 76 Downes Ave
- 50 Buffington Ave
- 164 N Railroad St
- 172 N Railroad St
- 998 Annadale Rd
- 237 Edgegrove Ave
- 218 Albee Ave
- 6 Mosely Ave
- 217 Edgegrove Ave
- 163 Bennett Ave
- 46 Hillis St
- 42 Mosely Ave
- 274 S Railroad St
- 8 Poillon Ave
- 162 Edgegrove Ave
- 242 Rathbun Ave
- 76 N Railroad St
- 66 N Railroad St
- 80 N Railroad St
- 60 N Railroad St
- 56 N Railroad St
- 79 N Railroad St
- 71 N Railroad St
- 86 N Railroad St
- 1088 Carlton Blvd
- 107 S Railroad St
- 52 N Railroad St
- 103 S Railroad St
- 111 S Railroad St
- 93 S Railroad St
- 117 S Railroad St
- 1084 Carlton Blvd
- 324 Detroit Ave
- 320 Detroit Ave
- 330 Detroit Ave
- 316 Detroit Ave