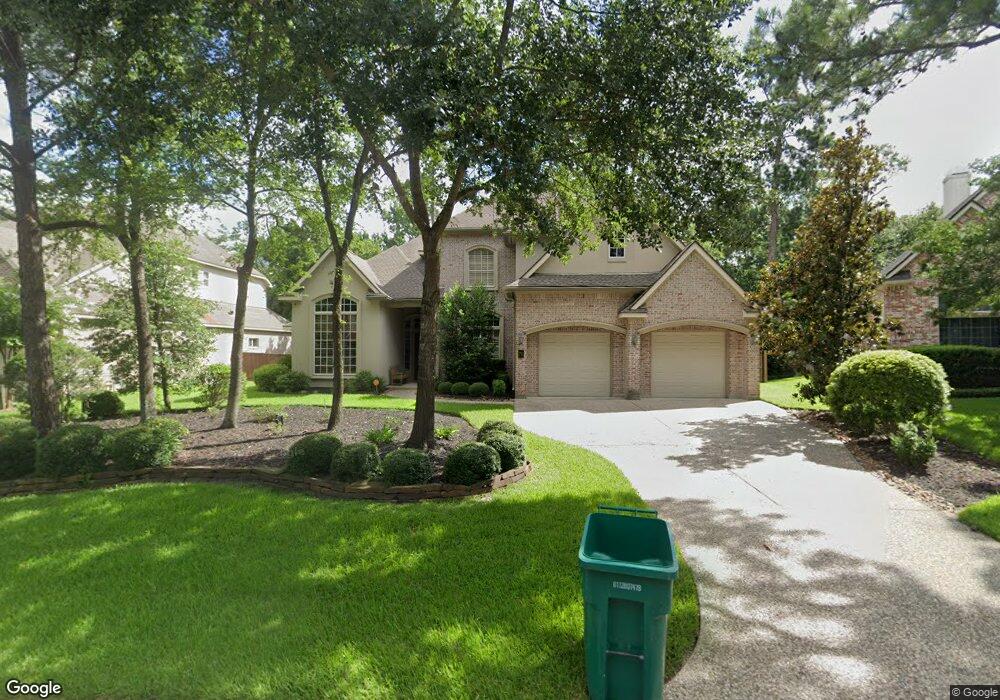
70 N Spring Trellis Cir Spring, TX 77382
Indian Springs NeighborhoodEstimated Value: $951,000 - $1,325,000
Studio
4
Baths
4,203
Sq Ft
$261/Sq Ft
Est. Value
About This Home
This home is located at 70 N Spring Trellis Cir, Spring, TX 77382 and is currently estimated at $1,096,414, approximately $260 per square foot. 70 N Spring Trellis Cir is a home located in Montgomery County with nearby schools including Galatas Elementary School, Mitchell Intermediate School, and McCullough Junior High School.
Ownership History
Date
Name
Owned For
Owner Type
Purchase Details
Closed on
Jul 30, 2007
Sold by
Jordan Robert P and Jordan Sarah
Bought by
Freund Lothar and Freund Gabriele
Current Estimated Value
Home Financials for this Owner
Home Financials are based on the most recent Mortgage that was taken out on this home.
Original Mortgage
$417,000
Outstanding Balance
$260,073
Interest Rate
6.73%
Mortgage Type
Purchase Money Mortgage
Estimated Equity
$836,341
Purchase Details
Closed on
Jun 25, 2001
Sold by
George Weaver Inc
Bought by
Jordan Robert P and Jordan Sarah
Home Financials for this Owner
Home Financials are based on the most recent Mortgage that was taken out on this home.
Original Mortgage
$275,000
Interest Rate
7.08%
Purchase Details
Closed on
Jun 1, 2000
Sold by
The Woodlands Land Development
Bought by
Freund Lothar and Freund Gabriele
Create a Home Valuation Report for This Property
The Home Valuation Report is an in-depth analysis detailing your home's value as well as a comparison with similar homes in the area
Home Values in the Area
Average Home Value in this Area
Purchase History
| Date | Buyer | Sale Price | Title Company |
|---|---|---|---|
| Freund Lothar | -- | United Title Of Texas | |
| Jordan Robert P | -- | First Surety Title Company | |
| Freund Lothar | -- | -- |
Source: Public Records
Mortgage History
| Date | Status | Borrower | Loan Amount |
|---|---|---|---|
| Open | Freund Lothar | $417,000 | |
| Previous Owner | Jordan Robert P | $275,000 |
Source: Public Records
Tax History
| Year | Tax Paid | Tax Assessment Tax Assessment Total Assessment is a certain percentage of the fair market value that is determined by local assessors to be the total taxable value of land and additions on the property. | Land | Improvement |
|---|---|---|---|---|
| 2025 | $13,412 | $881,140 | $140,000 | $741,140 |
| 2024 | $13,459 | $895,533 | $140,000 | $755,533 |
| 2023 | $13,459 | $858,560 | $140,000 | $786,770 |
| 2022 | $15,507 | $780,510 | $140,000 | $667,120 |
| 2021 | $15,127 | $709,550 | $58,740 | $650,810 |
| 2020 | $16,157 | $723,510 | $58,740 | $664,770 |
| 2019 | $15,252 | $661,200 | $58,740 | $602,460 |
| 2018 | $15,863 | $746,710 | $58,740 | $687,970 |
| 2017 | $18,312 | $783,890 | $58,740 | $725,150 |
| 2016 | $18,668 | $799,160 | $58,740 | $740,420 |
| 2015 | $16,601 | $764,980 | $58,740 | $706,240 |
| 2014 | $16,601 | $704,470 | $58,740 | $660,670 |
Source: Public Records
Map
Nearby Homes
- 31 Lenox Hill Ct
- 87 S Copper Sage Cir
- 71 Ivory Moon Place
- 6607 Lake Woodlands Dr Unit 223
- 6607 Lake Woodlands Dr Unit 312
- 14 Mystic Pines Ct
- 59 Douvaine Ct
- 7 N Spring Brook Ct
- 6 Douvaine Ct
- 26 Squire Creek Way
- 143 Hansom Trail St
- 82 S Warbler Bend Cir
- 7 Stanwick Place
- 27 Silver Maple Place
- 2 N Chantsong Cir
- 55 W Palmer Bend
- 3 Farington Way
- 87 Mediterra Way
- 27 E Palmer Bend
- 75 Mediterra Way
- 72 N Spring Trellis Cir
- 68 N Spring Trellis Cir
- 76 N Spring Trellis Cir
- 73 N Spring Trellis Cir
- 69 N Spring Trellis Cir
- 66 N Spring Trellis Cir
- 86 Lenox Hill Dr
- 82 Lenox Hill Dr
- 47 S Spring Trellis Cir
- 47 N Spring Trellis Cir
- 58 N Spring Trellis Cir
- 43 S Spring Trellis Cir
- 43 Trellis Ct
- 87 Lenox Hill Dr
- 78 Lenox Hill Dr
- 54 N Spring Trellis Cir
- 83 Lenox Hill Dr
- 79 Lenox Hill Dr
- 50 S Spring Trellis Cir
- 46 Trellis Ct
Your Personal Tour Guide
Ask me questions while you tour the home.