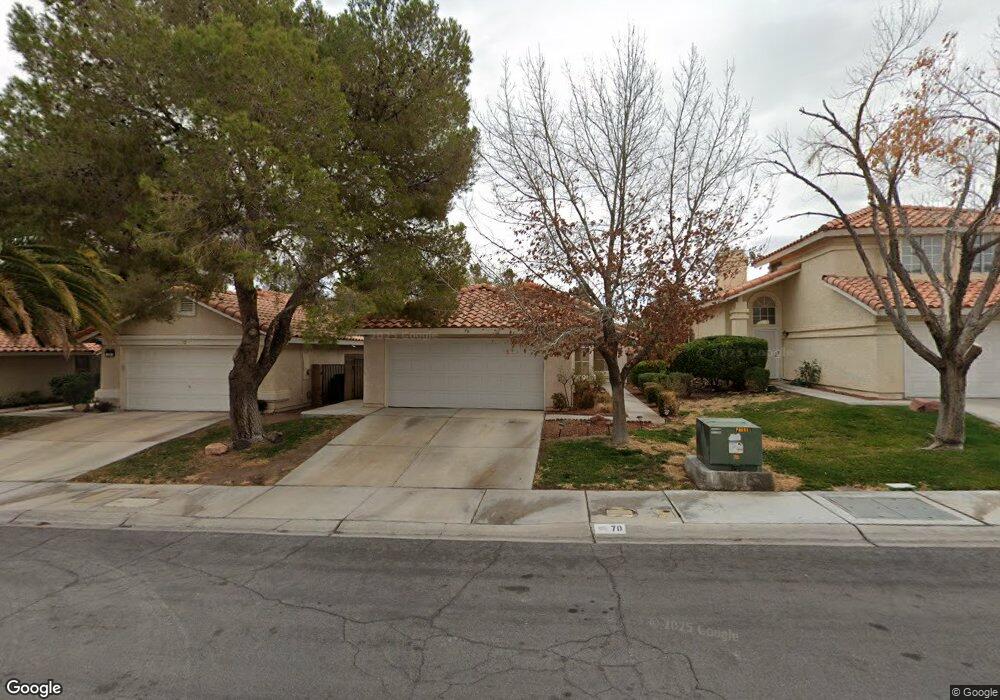
70 Quiet Desert Ln Henderson, NV 89074
Green Valley South NeighborhoodEstimated Value: $390,000 - $409,000
3
Beds
2
Baths
1,209
Sq Ft
$328/Sq Ft
Est. Value
About This Home
This home is located at 70 Quiet Desert Ln, Henderson, NV 89074 and is currently estimated at $396,351, approximately $327 per square foot. 70 Quiet Desert Ln is a home located in Clark County with nearby schools including Aggie Roberts Elementary School, Jack Lund Schofield Middle School, and Silverado High School.
Ownership History
Date
Name
Owned For
Owner Type
Purchase Details
Closed on
Feb 15, 2012
Sold by
Federal National Mortgage Association
Bought by
Tillman Nancy L
Current Estimated Value
Home Financials for this Owner
Home Financials are based on the most recent Mortgage that was taken out on this home.
Original Mortgage
$76,125
Outstanding Balance
$48,879
Interest Rate
2.62%
Mortgage Type
New Conventional
Estimated Equity
$347,472
Purchase Details
Closed on
Sep 16, 2011
Sold by
Patterson Pat
Bought by
Federal National Mortgage Association
Purchase Details
Closed on
Jul 13, 2010
Sold by
Patterson Patrick
Bought by
Patterson Pat and Pat Patterson Revocable Trust
Purchase Details
Closed on
Mar 8, 2000
Sold by
Guseff Donna D
Bought by
Patterson Patrick
Home Financials for this Owner
Home Financials are based on the most recent Mortgage that was taken out on this home.
Original Mortgage
$103,500
Interest Rate
8.34%
Purchase Details
Closed on
Dec 21, 1999
Sold by
Guseff Donna D and Guseff John
Bought by
Guseff Donna D
Create a Home Valuation Report for This Property
The Home Valuation Report is an in-depth analysis detailing your home's value as well as a comparison with similar homes in the area
Home Values in the Area
Average Home Value in this Area
Purchase History
| Date | Buyer | Sale Price | Title Company |
|---|---|---|---|
| Tillman Nancy L | $101,500 | Servicelink Irvine | |
| Federal National Mortgage Association | $79,900 | Premier American Title | |
| Patterson Pat | -- | None Available | |
| Patterson Patrick | $115,000 | Stewart Title | |
| Guseff Donna D | -- | -- |
Source: Public Records
Mortgage History
| Date | Status | Borrower | Loan Amount |
|---|---|---|---|
| Open | Tillman Nancy L | $76,125 | |
| Previous Owner | Patterson Patrick | $103,500 |
Source: Public Records
Tax History Compared to Growth
Tax History
| Year | Tax Paid | Tax Assessment Tax Assessment Total Assessment is a certain percentage of the fair market value that is determined by local assessors to be the total taxable value of land and additions on the property. | Land | Improvement |
|---|---|---|---|---|
| 2025 | $1,309 | $70,813 | $33,250 | $37,563 |
| 2024 | $1,272 | $70,813 | $33,250 | $37,563 |
| 2023 | $1,037 | $64,246 | $28,000 | $36,246 |
| 2022 | $1,294 | $58,966 | $25,550 | $33,416 |
| 2021 | $1,199 | $54,434 | $22,400 | $32,034 |
| 2020 | $1,161 | $54,092 | $22,050 | $32,042 |
| 2019 | $1,147 | $51,034 | $19,250 | $31,784 |
| 2018 | $1,094 | $47,325 | $16,450 | $30,875 |
| 2017 | $1,037 | $46,734 | $15,400 | $31,334 |
| 2016 | $1,037 | $42,557 | $10,850 | $31,707 |
| 2015 | $1,036 | $40,591 | $9,100 | $31,491 |
| 2014 | $1,004 | $33,529 | $7,000 | $26,529 |
Source: Public Records
Map
Nearby Homes
- 43 Fantasia Ln
- 36 Tidwell Ln
- 112 Wynntry Dr
- 2813 Cacto Ct
- 2802 Camelback Ln
- 21 Megan Dr Unit 3
- 2719 Lovington Dr
- 2925 Wigwam Pkwy Unit 724
- 2925 Wigwam Pkwy Unit 1124
- 2925 Wigwam Pkwy Unit 1021
- 2925 Wigwam Pkwy Unit 2021
- 2534 Quail Canyon Ave
- 2713 Knightsbridge Rd
- 8953 Belconte Ln
- 2720 Knightsbridge Rd
- 2716 Knightsbridge Rd
- 8758 Arawana Place
- 167 Wynntry Cir
- 8753 Arawana Place
- 2468 Parker James Ave Unit 2
- 68 Quiet Desert Ln
- 72 Quiet Desert Ln
- 66 Quiet Desert Ln
- 74 Quiet Desert Ln
- 64 Quiet Desert Ln
- 76 Quiet Desert Ln
- 63 Fantasia Ln Unit 1
- 61 Fantasia Ln
- 65 Fantasia Ln
- 59 Fantasia Ln
- 2801 Whisper Ln
- 62 Quiet Desert Ln
- 78 Quiet Desert Ln
- 67 Fantasia Ln
- 57 Fantasia Ln
- 2802 Whisper Ln
- 2803 Whisper Ln Unit 2
- 60 Quiet Desert Ln
- 80 Quiet Desert Ln
- 2802 Prickley Pear Dr