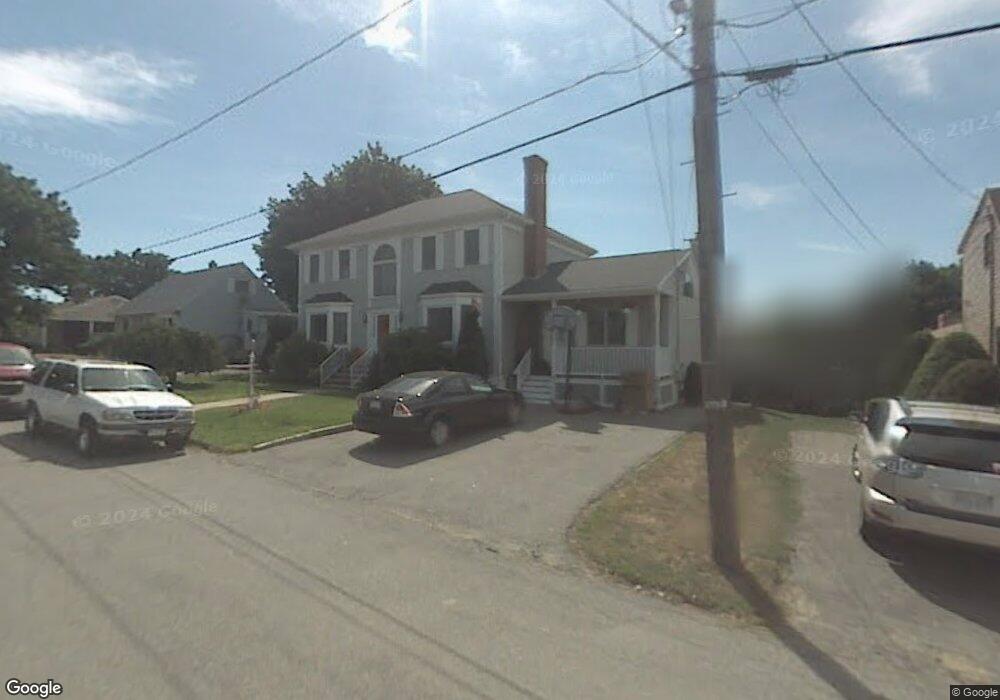
70 Randall Rd Revere, MA 02151
West Revere NeighborhoodEstimated Value: $689,000 - $817,000
3
Beds
3
Baths
2,303
Sq Ft
$334/Sq Ft
Est. Value
About This Home
This home is located at 70 Randall Rd, Revere, MA 02151 and is currently estimated at $768,458, approximately $333 per square foot. 70 Randall Rd is a home located in Suffolk County with nearby schools including A.C. Whelan Elementary School, Staff Sargent James J. Hill Elementary School, and Susan B. Anthony Middle School.
Ownership History
Date
Name
Owned For
Owner Type
Purchase Details
Closed on
Oct 4, 1991
Sold by
Rosa Jeanne M
Bought by
Russo Luigi and Russo Rachel
Current Estimated Value
Home Financials for this Owner
Home Financials are based on the most recent Mortgage that was taken out on this home.
Original Mortgage
$96,000
Interest Rate
9.08%
Mortgage Type
Purchase Money Mortgage
Create a Home Valuation Report for This Property
The Home Valuation Report is an in-depth analysis detailing your home's value as well as a comparison with similar homes in the area
Home Values in the Area
Average Home Value in this Area
Purchase History
| Date | Buyer | Sale Price | Title Company |
|---|---|---|---|
| Russo Luigi | $123,000 | -- | |
| Russo Luigi | $123,000 | -- |
Source: Public Records
Mortgage History
| Date | Status | Borrower | Loan Amount |
|---|---|---|---|
| Closed | Russo Luigi | $75,000 | |
| Closed | Russo Luigi | $96,000 |
Source: Public Records
Tax History Compared to Growth
Tax History
| Year | Tax Paid | Tax Assessment Tax Assessment Total Assessment is a certain percentage of the fair market value that is determined by local assessors to be the total taxable value of land and additions on the property. | Land | Improvement |
|---|---|---|---|---|
| 2025 | $6,576 | $725,000 | $290,700 | $434,300 |
| 2024 | $6,396 | $702,100 | $274,500 | $427,600 |
| 2023 | $6,144 | $646,100 | $229,300 | $416,800 |
| 2022 | $6,053 | $582,000 | $218,000 | $364,000 |
| 2021 | $5,661 | $511,800 | $201,900 | $309,900 |
| 2020 | $5,672 | $503,700 | $193,800 | $309,900 |
| 2019 | $5,849 | $483,000 | $203,500 | $279,500 |
| 2018 | $5,622 | $433,800 | $171,200 | $262,600 |
| 2017 | $5,329 | $380,900 | $145,300 | $235,600 |
| 2016 | $4,760 | $329,400 | $132,400 | $197,000 |
| 2015 | $4,875 | $329,400 | $132,400 | $197,000 |
Source: Public Records
Map
Nearby Homes
- 78 Festa Rd
- 53 Wentworth Rd
- 459 Malden St
- 295 Sargent St
- 70 Cecilian Ave
- 59 Carlson Ave
- 17 Lantern Rd
- 33 Lantern Rd
- 51 Keayne St
- 48 Newman St
- 112 Sigourney St Unit 2
- 690 Washington Ave
- 50 Genesee St
- 60 Essex St
- 34 Jarvis St
- 528 Proctor Ave
- 770 Washington Ave Unit 405
- 74 Gage Ave
- 23 Essex St
- 69 Pitcairn St