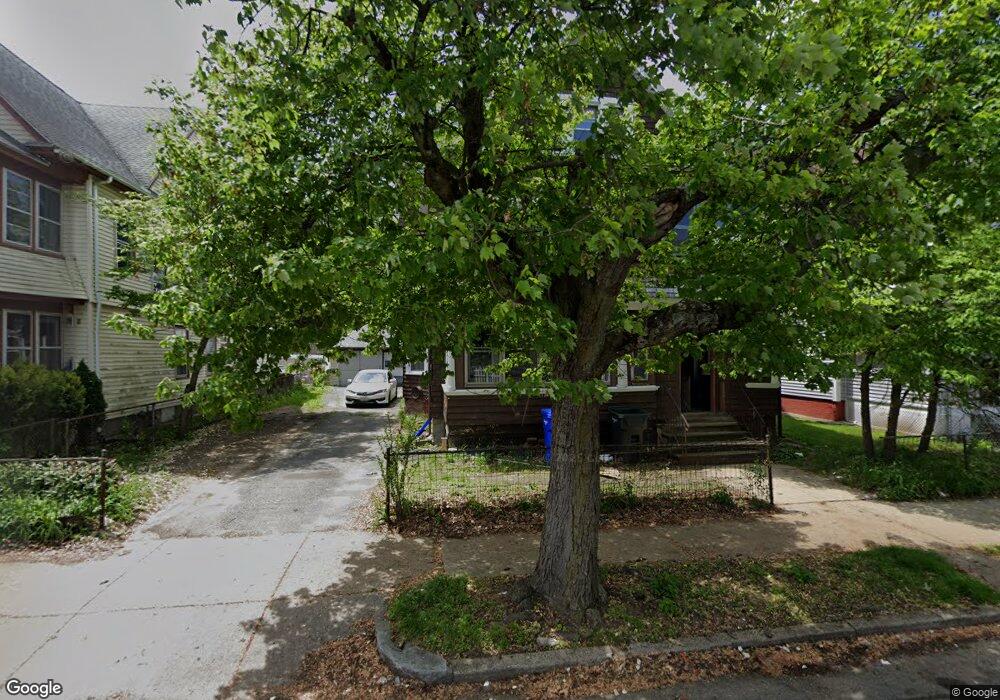
70 Ranney St Unit 72 Springfield, MA 01108
Forest Park NeighborhoodEstimated Value: $357,000 - $421,000
6
Beds
2
Baths
3,228
Sq Ft
$118/Sq Ft
Est. Value
About This Home
This home is located at 70 Ranney St Unit 72, Springfield, MA 01108 and is currently estimated at $382,301, approximately $118 per square foot. 70 Ranney St Unit 72 is a home located in Hampden County with nearby schools including White Street Elementary School, Forest Park Middle School, and High School Of Commerce.
Ownership History
Date
Name
Owned For
Owner Type
Purchase Details
Closed on
May 3, 2022
Sold by
Dauntless Path Llc
Bought by
Miller Jada L
Current Estimated Value
Home Financials for this Owner
Home Financials are based on the most recent Mortgage that was taken out on this home.
Original Mortgage
$160,000
Outstanding Balance
$149,890
Interest Rate
4.16%
Mortgage Type
Purchase Money Mortgage
Estimated Equity
$232,411
Purchase Details
Closed on
Mar 14, 2022
Sold by
Perez Neri Est and Ursprung
Bought by
Dauntless Path Llc
Home Financials for this Owner
Home Financials are based on the most recent Mortgage that was taken out on this home.
Original Mortgage
$160,000
Outstanding Balance
$149,890
Interest Rate
4.16%
Mortgage Type
Purchase Money Mortgage
Estimated Equity
$232,411
Purchase Details
Closed on
Feb 14, 2011
Sold by
Perez Neri and Perez Dolores A
Bought by
Springfield City Of
Create a Home Valuation Report for This Property
The Home Valuation Report is an in-depth analysis detailing your home's value as well as a comparison with similar homes in the area
Home Values in the Area
Average Home Value in this Area
Purchase History
| Date | Buyer | Sale Price | Title Company |
|---|---|---|---|
| Miller Jada L | $160,000 | None Available | |
| Dauntless Path Llc | $85,000 | None Available | |
| Springfield City Of | $642 | -- | |
| Springfield City Of | $642 | -- |
Source: Public Records
Mortgage History
| Date | Status | Borrower | Loan Amount |
|---|---|---|---|
| Open | Miller Jada L | $160,000 | |
| Previous Owner | Dauntless Path Llc | $120,000 | |
| Previous Owner | Springfield City Of | $44,000 | |
| Previous Owner | Springfield City Of | $71,500 |
Source: Public Records
Tax History
| Year | Tax Paid | Tax Assessment Tax Assessment Total Assessment is a certain percentage of the fair market value that is determined by local assessors to be the total taxable value of land and additions on the property. | Land | Improvement |
|---|---|---|---|---|
| 2025 | $4,999 | $318,800 | $30,900 | $287,900 |
| 2024 | $4,465 | $278,000 | $30,900 | $247,100 |
| 2023 | $3,050 | $178,900 | $28,100 | $150,800 |
| 2022 | $2,996 | $159,200 | $26,200 | $133,000 |
| 2021 | $2,892 | $153,000 | $23,800 | $129,200 |
| 2020 | $2,849 | $145,900 | $23,800 | $122,100 |
| 2019 | $2,665 | $135,400 | $23,800 | $111,600 |
| 2018 | $2,454 | $131,200 | $23,800 | $107,400 |
| 2017 | $2,454 | $124,800 | $22,300 | $102,500 |
| 2016 | $2,111 | $107,400 | $22,300 | $85,100 |
| 2015 | $2,063 | $104,900 | $22,300 | $82,600 |
Source: Public Records
Map
Nearby Homes
- 70-72 Ranney St
- 76 Ranney St Unit 78
- 66 Ranney St Unit 68
- 141 Bloomfield St Unit 143
- 141-143 Bloomfield St
- 82 Ranney St Unit 84
- 82-84 Ranney St
- 135 Bloomfield St Unit 137
- 140 Johnson St Unit 142
- 86 Ranney St Unit 88
- 56 Ranney St Unit 58
- 69 Ranney St Unit 71
- 75 Ranney St
- 163 Bloomfield St
- 131 Bloomfield St Unit 133
- 134 Johnson St Unit 136
- 79 Ranney St Unit 81
- 79-81 Ranney St
- 134 Johnson St
- 164 Johnson St
Your Personal Tour Guide
Ask me questions while you tour the home.