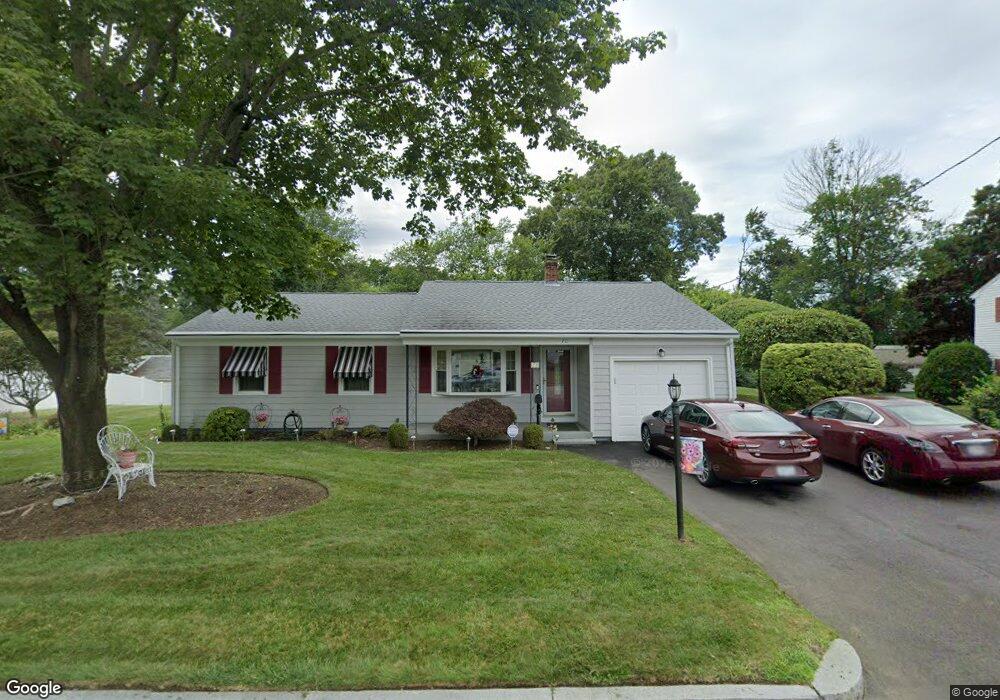
70 Rustic Dr Woonsocket, RI 02895
East Woonsocket NeighborhoodEstimated Value: $419,383 - $472,000
3
Beds
1
Bath
1,400
Sq Ft
$313/Sq Ft
Est. Value
About This Home
This home is located at 70 Rustic Dr, Woonsocket, RI 02895 and is currently estimated at $438,596, approximately $313 per square foot. 70 Rustic Dr is a home located in Providence County with nearby schools including Woonsocket High School, Rise Prep Mayoral Academy Middle School, and Rise Prep Mayoral Academy.
Ownership History
Date
Name
Owned For
Owner Type
Purchase Details
Closed on
Aug 23, 2024
Sold by
Lamansky Constance M
Bought by
Constance M Lamansky Ret and Lamansky
Current Estimated Value
Purchase Details
Closed on
Dec 30, 1994
Sold by
Vanniel James R and Vanniel Marjorie
Bought by
Lamansky Constance M
Create a Home Valuation Report for This Property
The Home Valuation Report is an in-depth analysis detailing your home's value as well as a comparison with similar homes in the area
Home Values in the Area
Average Home Value in this Area
Purchase History
| Date | Buyer | Sale Price | Title Company |
|---|---|---|---|
| Constance M Lamansky Ret | -- | None Available | |
| Constance M Lamansky Ret | -- | None Available | |
| Lamansky Constance M | $98,500 | -- | |
| Lamansky Constance M | $98,500 | -- |
Source: Public Records
Mortgage History
| Date | Status | Borrower | Loan Amount |
|---|---|---|---|
| Previous Owner | Lamansky Constance M | $64,248 | |
| Previous Owner | Lamansky Constance M | $13,681 | |
| Previous Owner | Lamansky Constance M | $11,200 |
Source: Public Records
Tax History
| Year | Tax Paid | Tax Assessment Tax Assessment Total Assessment is a certain percentage of the fair market value that is determined by local assessors to be the total taxable value of land and additions on the property. | Land | Improvement |
|---|---|---|---|---|
| 2025 | $4,746 | $422,600 | $126,100 | $296,500 |
| 2024 | $4,109 | $282,600 | $97,400 | $185,200 |
| 2023 | $3,951 | $282,600 | $97,400 | $185,200 |
| 2022 | $3,951 | $282,600 | $97,400 | $185,200 |
| 2021 | $4,287 | $180,500 | $75,400 | $105,100 |
| 2020 | $4,332 | $180,500 | $75,400 | $105,100 |
| 2018 | $4,346 | $180,500 | $75,400 | $105,100 |
| 2017 | $5,180 | $172,100 | $74,400 | $97,700 |
| 2016 | $5,480 | $172,100 | $74,400 | $97,700 |
| 2015 | $6,295 | $172,100 | $74,400 | $97,700 |
| 2014 | $6,422 | $178,700 | $82,000 | $96,700 |
Source: Public Records
Map
Nearby Homes
- 727 Mendon Rd
- 95 Mitris Blvd
- 202 Paine St
- 194 Paine St
- 68 Kenwood St
- 4 Carnation St
- 82 Paine St
- 24 Palmetto Dr Unit 24
- 212 Saint Louis Ave
- 188 Saint Louis Ave
- 178 Saint Louis Ave
- 9 Pebble Cir Unit 9
- 20 Nature View Dr
- 21 Palmetto Dr Unit 21
- 65 Palmetto Dr Unit 65
- 110 Saint Leon Ave
- 23 Rutland St
- 25 Nature View Dr
- 375 Congress St
- 21 Irving St
Your Personal Tour Guide
Ask me questions while you tour the home.