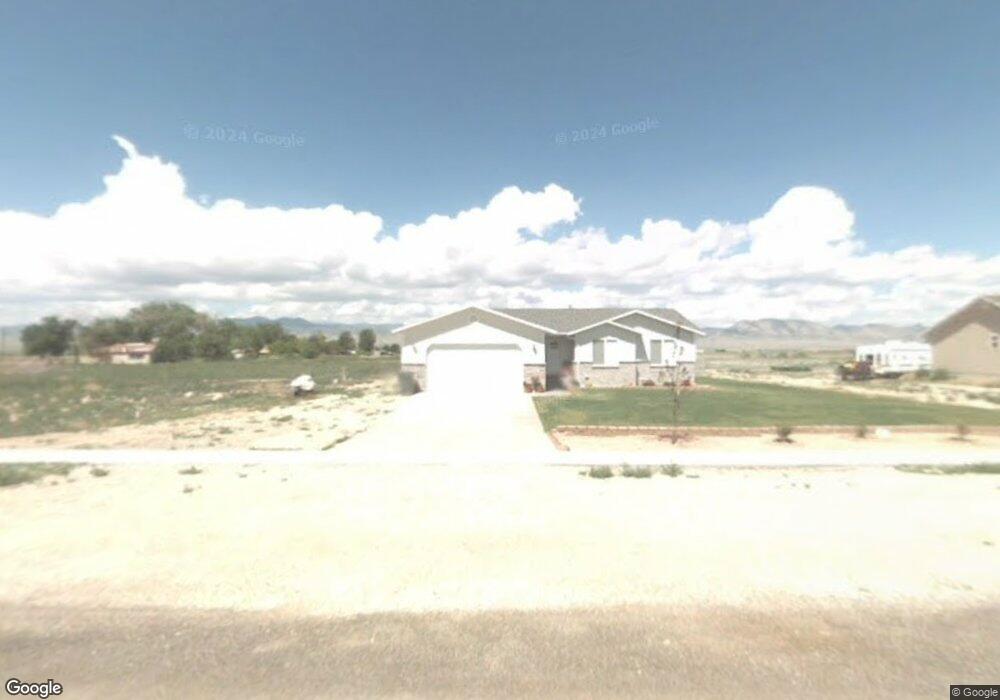
70 S 200 W Centerfield, UT 84622
Estimated Value: $389,000 - $465,729
Studio
--
Bath
2,490
Sq Ft
$171/Sq Ft
Est. Value
About This Home
This home is located at 70 S 200 W, Centerfield, UT 84622 and is currently estimated at $424,682, approximately $170 per square foot. 70 S 200 W is a home.
Ownership History
Date
Name
Owned For
Owner Type
Purchase Details
Closed on
Sep 16, 2021
Sold by
Piep Jordan
Bought by
Lambert Richard Mark
Current Estimated Value
Home Financials for this Owner
Home Financials are based on the most recent Mortgage that was taken out on this home.
Original Mortgage
$115,000
Outstanding Balance
$104,118
Interest Rate
2.9%
Mortgage Type
New Conventional
Estimated Equity
$320,564
Purchase Details
Closed on
Nov 7, 2017
Sold by
Nelson Allen S and Nelson Tera L
Bought by
Piep Jorden
Purchase Details
Closed on
Mar 6, 2006
Sold by
Petersen Kasey
Bought by
Nelson Allen Shane and Nelson Tera Lyn
Create a Home Valuation Report for This Property
The Home Valuation Report is an in-depth analysis detailing your home's value as well as a comparison with similar homes in the area
Home Values in the Area
Average Home Value in this Area
Purchase History
| Date | Buyer | Sale Price | Title Company |
|---|---|---|---|
| Lambert Richard Mark | $143,750 | Central Utah Title | |
| Piep Jorden | -- | -- | |
| Nelson Allen Shane | -- | -- |
Source: Public Records
Mortgage History
| Date | Status | Borrower | Loan Amount |
|---|---|---|---|
| Open | Lambert Richard Mark | $115,000 |
Source: Public Records
Tax History
| Year | Tax Paid | Tax Assessment Tax Assessment Total Assessment is a certain percentage of the fair market value that is determined by local assessors to be the total taxable value of land and additions on the property. | Land | Improvement |
|---|---|---|---|---|
| 2025 | $1,979 | $208,003 | $0 | $0 |
| 2024 | $1,980 | $198,246 | $0 | $0 |
| 2023 | $1,934 | $183,208 | $0 | $0 |
| 2022 | $1,893 | $163,580 | $0 | $0 |
| 2021 | $1,684 | $126,232 | $0 | $0 |
| 2020 | $1,566 | $110,790 | $0 | $0 |
| 2019 | $1,479 | $103,094 | $0 | $0 |
| 2018 | $1,376 | $168,382 | $35,041 | $133,341 |
| 2017 | $1,291 | $92,836 | $0 | $0 |
| 2016 | $1,218 | $87,570 | $0 | $0 |
| 2015 | $1,221 | $87,570 | $0 | $0 |
| 2014 | $1,196 | $87,570 | $0 | $0 |
| 2013 | $1,179 | $87,027 | $0 | $0 |
Source: Public Records
Map
Nearby Homes
Your Personal Tour Guide
Ask me questions while you tour the home.