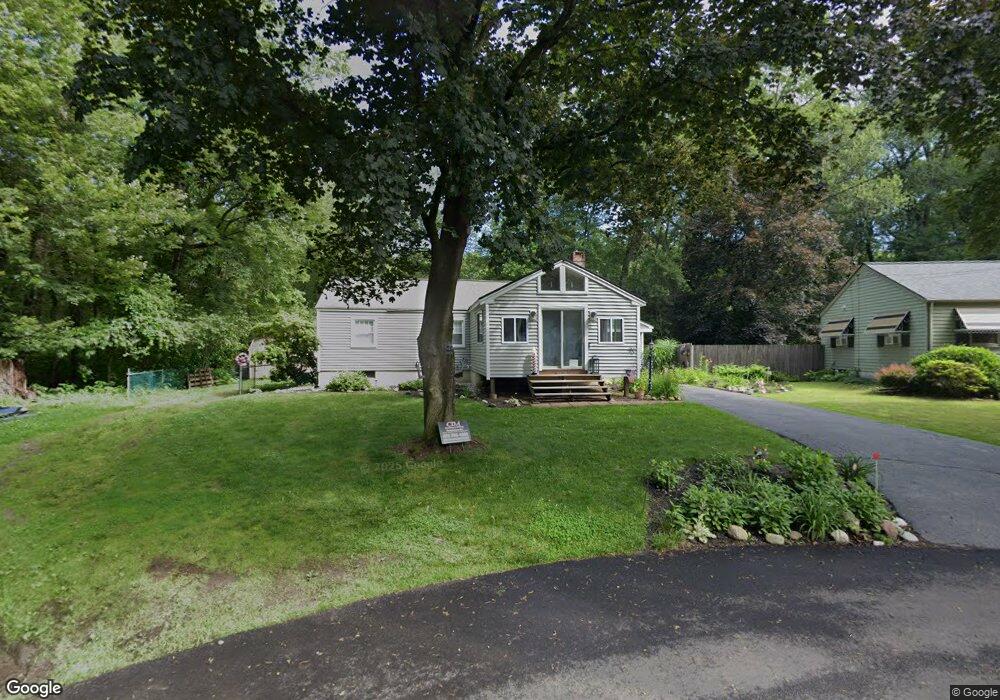
70 Simpson Cir Agawam, MA 01001
Estimated Value: $306,701 - $384,000
3
Beds
1
Bath
1,048
Sq Ft
$328/Sq Ft
Est. Value
About This Home
This home is located at 70 Simpson Cir, Agawam, MA 01001 and is currently estimated at $344,175, approximately $328 per square foot. 70 Simpson Cir is a home located in Hampden County with nearby schools including Agawam Junior High School, Agawam High School, and Veritas Preparatory Charter School.
Ownership History
Date
Name
Owned For
Owner Type
Purchase Details
Closed on
Feb 25, 2019
Sold by
Moran Laura L and Kibbe Stuart A
Bought by
Kibbe Louise
Current Estimated Value
Purchase Details
Closed on
Jun 30, 2015
Sold by
Patnode Lisa K
Bought by
Moran Laura L and Kibbe Stuart A
Purchase Details
Closed on
Oct 9, 2012
Sold by
Kibbe Stuart A and Kibbe Shirley A
Bought by
Patnode Lisa K and Moran Laura L
Purchase Details
Closed on
Sep 21, 2010
Sold by
Martin Cindy A and Martin William P
Bought by
Kibbe Shirley A and Kibbe Stuart A
Purchase Details
Closed on
Feb 3, 2010
Sold by
Martin Cindy A
Bought by
Martin Cindy A and Martin William P
Purchase Details
Closed on
Oct 20, 2008
Sold by
Martin William P
Bought by
Ingoldsby Naomi H and Martin Cindy A
Purchase Details
Closed on
Jul 9, 2007
Sold by
Martin Cindy A and Ingoldsby Naomi H
Bought by
Martin Cindy A and Ingoldsby Naomi H
Purchase Details
Closed on
Jun 28, 2007
Sold by
Martin Cindy A and Ingoldsby Naomi H
Bought by
Martin Cindy A and Ingoldsby Naomi H
Purchase Details
Closed on
Mar 14, 2005
Sold by
Ingoldsby Naomi H
Bought by
Martin Cindy A and Ingoldsby Naomi H
Create a Home Valuation Report for This Property
The Home Valuation Report is an in-depth analysis detailing your home's value as well as a comparison with similar homes in the area
Home Values in the Area
Average Home Value in this Area
Purchase History
| Date | Buyer | Sale Price | Title Company |
|---|---|---|---|
| Kibbe Louise | -- | -- | |
| Moran Laura L | -- | -- | |
| Patnode Lisa K | -- | -- | |
| Kibbe Shirley A | $180,000 | -- | |
| Martin Cindy A | -- | -- | |
| Ingoldsby Naomi H | -- | -- | |
| Martin Cindy A | -- | -- | |
| Martin Cindy A | -- | -- | |
| Martin Cindy A | -- | -- |
Source: Public Records
Tax History Compared to Growth
Tax History
| Year | Tax Paid | Tax Assessment Tax Assessment Total Assessment is a certain percentage of the fair market value that is determined by local assessors to be the total taxable value of land and additions on the property. | Land | Improvement |
|---|---|---|---|---|
| 2025 | $3,868 | $264,200 | $102,400 | $161,800 |
| 2024 | $3,759 | $258,500 | $102,400 | $156,100 |
| 2023 | $3,431 | $217,400 | $88,800 | $128,600 |
| 2022 | $3,296 | $204,600 | $88,800 | $115,800 |
| 2021 | $3,170 | $188,700 | $78,100 | $110,600 |
| 2020 | $3,102 | $184,300 | $76,900 | $107,400 |
| 2019 | $3,012 | $180,900 | $75,400 | $105,500 |
| 2018 | $2,867 | $172,600 | $75,400 | $97,200 |
| 2017 | $2,734 | $167,600 | $75,400 | $92,200 |
| 2016 | $2,723 | $168,300 | $75,400 | $92,900 |
| 2015 | -- | $164,000 | $75,400 | $88,600 |
Source: Public Records
Map
Nearby Homes
- 95 Meadowbrook Rd
- 51 Merrell Dr
- 25 Clifton Dr
- 49 Hearthstone Dr
- 28 Meadow Ave
- 18 Wildflower Ln
- 85 Alhambra Cir N
- 60 Alhambra Cir S
- 44 Riverview Ave
- 86 Alhambra Cir N
- 118 Field Rd
- 109 Regency Park Dr Unit 109
- 124 Regency Park Dr
- 52 Peros Dr
- 50 Elmwood Ave
- 82 West Rd
- 236 Regency Park Dr
- 1168 River Rd
- 253 Regency Park Dr
- 795 Main St
- 64 Simpson Cir
- 58 Simpson Cir
- 52 Simpson Cir
- 75 Simpson Cir
- 59 Simpson Cir
- 46 Simpson Cir
- 49 Simpson Cir
- 40 Simpson Cir
- 43 Simpson Cir
- 37 Simpson Cir
- 80 Simpson Cir
- 61 Meadowbrook Rd
- 34 Simpson Cir
- 69 Meadowbrook Rd
- 79 Simpson Cir
- 31 Simpson Cir
- 77 Meadowbrook Rd
- 28 Simpson Cir
- 31 Meadowbrook Rd
- 23 Simpson Cir