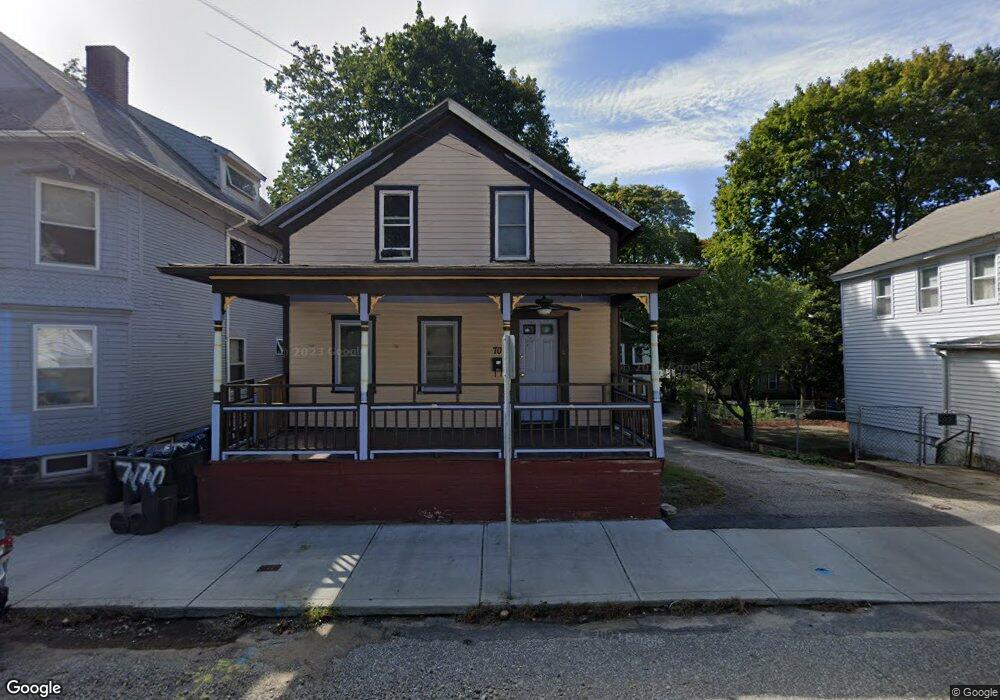
70 Spring St Willimantic, CT 06226
Estimated Value: $188,000 - $216,611
3
Beds
2
Baths
968
Sq Ft
$205/Sq Ft
Est. Value
About This Home
This home is located at 70 Spring St, Willimantic, CT 06226 and is currently estimated at $198,903, approximately $205 per square foot. 70 Spring St is a home located in Windham County with nearby schools including Windham Middle School, Windham High School, and St Mary St Joseph School.
Ownership History
Date
Name
Owned For
Owner Type
Purchase Details
Closed on
Jan 31, 2017
Sold by
Comerford Mark S and Comerford Joanne A
Bought by
Reilly Jacob S
Current Estimated Value
Home Financials for this Owner
Home Financials are based on the most recent Mortgage that was taken out on this home.
Original Mortgage
$60,000
Outstanding Balance
$49,622
Interest Rate
4.16%
Mortgage Type
New Conventional
Estimated Equity
$149,281
Purchase Details
Closed on
Jan 1, 1987
Bought by
Comerford Mark S and Comerford Joanne A
Create a Home Valuation Report for This Property
The Home Valuation Report is an in-depth analysis detailing your home's value as well as a comparison with similar homes in the area
Home Values in the Area
Average Home Value in this Area
Purchase History
| Date | Buyer | Sale Price | Title Company |
|---|---|---|---|
| Reilly Jacob S | $65,000 | -- | |
| Comerford Mark S | -- | -- |
Source: Public Records
Mortgage History
| Date | Status | Borrower | Loan Amount |
|---|---|---|---|
| Open | Comerford Mark S | $60,000 | |
| Previous Owner | Comerford Mark S | $80,000 |
Source: Public Records
Tax History
| Year | Tax Paid | Tax Assessment Tax Assessment Total Assessment is a certain percentage of the fair market value that is determined by local assessors to be the total taxable value of land and additions on the property. | Land | Improvement |
|---|---|---|---|---|
| 2025 | $3,731 | $100,790 | $19,680 | $81,110 |
| 2024 | $3,735 | $100,790 | $19,680 | $81,110 |
| 2023 | $2,541 | $53,610 | $13,690 | $39,920 |
| 2022 | $2,504 | $53,610 | $13,690 | $39,920 |
| 2021 | $2,685 | $53,610 | $13,690 | $39,920 |
| 2020 | $2,679 | $53,610 | $13,690 | $39,920 |
| 2019 | $2,636 | $53,610 | $13,690 | $39,920 |
| 2017 | $2,600 | $54,610 | $18,750 | $35,860 |
| 2015 | $1,876 | $54,610 | $18,750 | $35,860 |
| 2014 | $2,372 | $54,610 | $18,750 | $35,860 |
Source: Public Records
Map
Nearby Homes
Your Personal Tour Guide
Ask me questions while you tour the home.