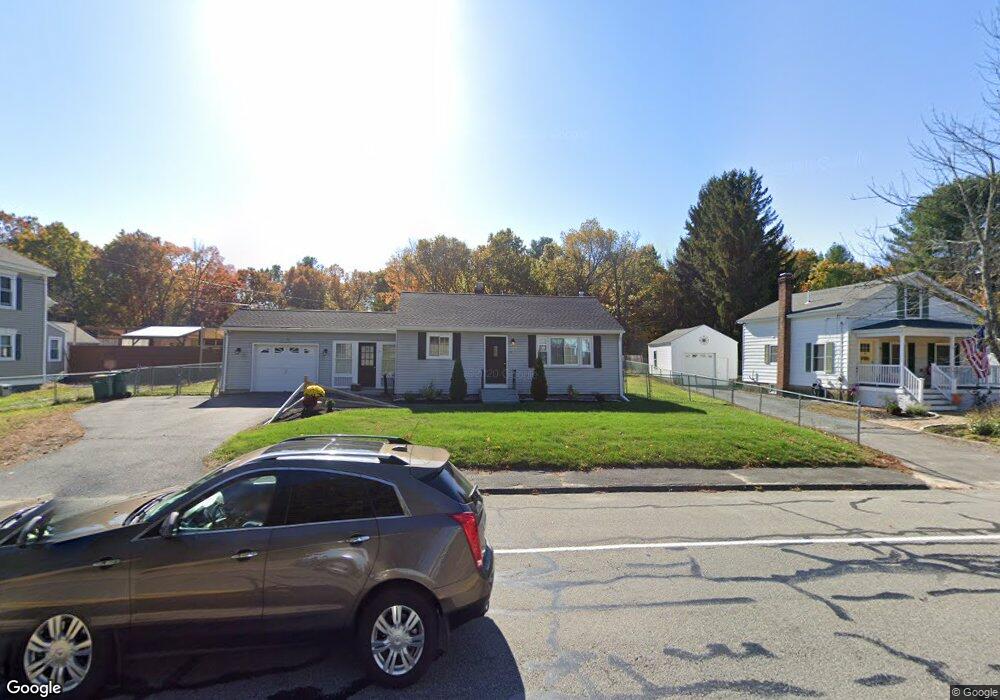
70 Sterling St Lancaster, MA 01523
Estimated Value: $338,000 - $416,000
1
Bed
1
Bath
832
Sq Ft
$466/Sq Ft
Est. Value
About This Home
This home is located at 70 Sterling St, Lancaster, MA 01523 and is currently estimated at $387,358, approximately $465 per square foot. 70 Sterling St is a home located in Worcester County with nearby schools including Mary Rowlandson Elementary School, Luther Burbank Middle School, and Nashoba Regional High School.
Ownership History
Date
Name
Owned For
Owner Type
Purchase Details
Closed on
Jul 6, 2022
Sold by
Fitzgerald Brian J
Bought by
Fitzgerald Brian J and Fitzgerald Marissa
Current Estimated Value
Home Financials for this Owner
Home Financials are based on the most recent Mortgage that was taken out on this home.
Original Mortgage
$190,000
Outstanding Balance
$178,473
Interest Rate
3.75%
Mortgage Type
Adjustable Rate Mortgage/ARM
Estimated Equity
$208,885
Purchase Details
Closed on
Jul 7, 2016
Sold by
Metivier Doris Est
Bought by
Fitzgerald Brian J
Home Financials for this Owner
Home Financials are based on the most recent Mortgage that was taken out on this home.
Original Mortgage
$126,000
Interest Rate
4%
Mortgage Type
Adjustable Rate Mortgage/ARM
Purchase Details
Closed on
Jun 30, 1971
Bought by
Metivier Doris
Create a Home Valuation Report for This Property
The Home Valuation Report is an in-depth analysis detailing your home's value as well as a comparison with similar homes in the area
Home Values in the Area
Average Home Value in this Area
Purchase History
| Date | Buyer | Sale Price | Title Company |
|---|---|---|---|
| Fitzgerald Brian J | -- | None Available | |
| Fitzgerald Brian J | -- | None Available | |
| Fitzgerald Brian J | $140,000 | -- | |
| Metivier Doris | -- | -- | |
| Fitzgerald Brian J | $140,000 | -- |
Source: Public Records
Mortgage History
| Date | Status | Borrower | Loan Amount |
|---|---|---|---|
| Open | Fitzgerald Brian J | $190,000 | |
| Closed | Fitzgerald Brian J | $190,000 | |
| Previous Owner | Fitzgerald Brian J | $126,000 |
Source: Public Records
Tax History Compared to Growth
Tax History
| Year | Tax Paid | Tax Assessment Tax Assessment Total Assessment is a certain percentage of the fair market value that is determined by local assessors to be the total taxable value of land and additions on the property. | Land | Improvement |
|---|---|---|---|---|
| 2025 | $4,746 | $293,700 | $100,700 | $193,000 |
| 2024 | $4,812 | $275,600 | $91,700 | $183,900 |
| 2023 | $4,409 | $256,500 | $83,400 | $173,100 |
| 2022 | $4,081 | $209,800 | $77,800 | $132,000 |
| 2021 | $3,998 | $200,100 | $77,800 | $122,300 |
| 2020 | $3,867 | $194,800 | $77,800 | $117,000 |
| 2019 | $3,644 | $184,500 | $77,800 | $106,700 |
| 2018 | $3,451 | $172,700 | $77,800 | $94,900 |
| 2016 | $3,284 | $168,000 | $77,000 | $91,000 |
| 2015 | $3,118 | $166,200 | $77,000 | $89,200 |
| 2014 | $3,058 | $161,700 | $77,000 | $84,700 |
Source: Public Records
Map
Nearby Homes
- 19 Magnolia Ave
- 51 Rigby St
- 248 Greeley St
- 271 Sterling St
- 54 S Meadow Rd
- 116-118 Lawrence St
- 24 Rigby St
- 526 S Meadow Rd
- 19 Sprague Rd
- 55 Sterling St Unit 306
- 55 Sterling St Unit 314
- 119 Clark St
- 53 Beach Point Rd
- 57 Clark St
- 164 Sterling Rd
- 6 Worcester St
- 403 Main St
- 284 Main St
- 121 Sylvan Rd
- 38 Norman St