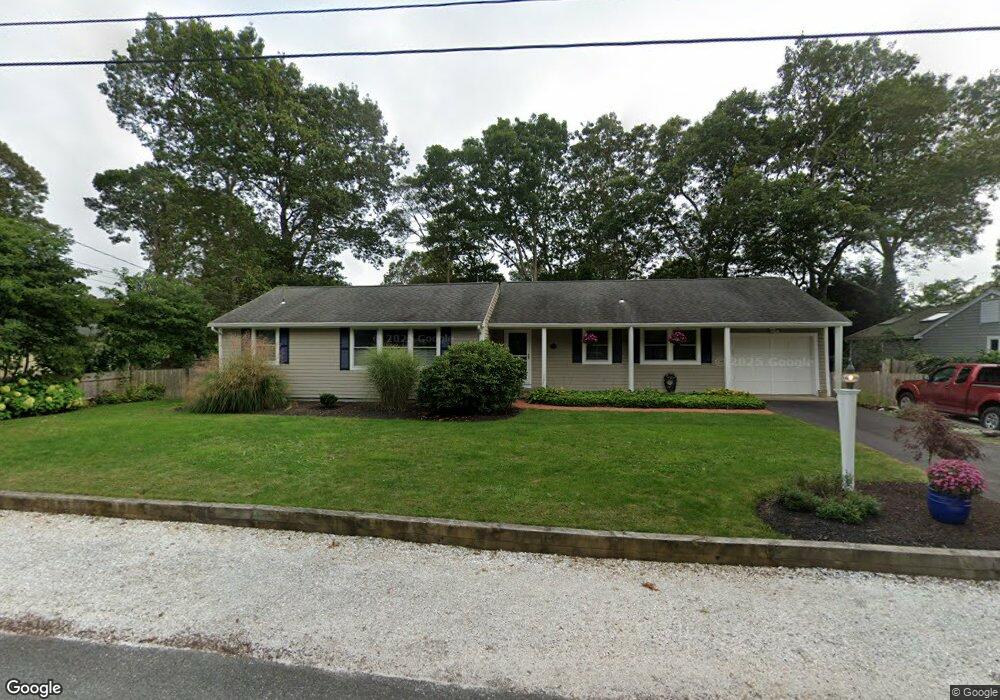
70 Striper Ln East Falmouth, MA 02536
Estimated Value: $785,000 - $872,000
3
Beds
2
Baths
1,501
Sq Ft
$554/Sq Ft
Est. Value
About This Home
This home is located at 70 Striper Ln, East Falmouth, MA 02536 and is currently estimated at $831,321, approximately $553 per square foot. 70 Striper Ln is a home located in Barnstable County with nearby schools including Teaticket Elementary School, Morse Pond School, and Lawrence School.
Ownership History
Date
Name
Owned For
Owner Type
Purchase Details
Closed on
Jan 25, 2019
Sold by
Viliesis-Jamal Alice and Jamal Nadim
Bought by
Nadim Jamal Ret and Viliesis-Jamal
Current Estimated Value
Purchase Details
Closed on
May 15, 1995
Sold by
Dudley James C and Dudley Faith E
Bought by
Jamal Nadim and Jamal Alice Viliesis
Create a Home Valuation Report for This Property
The Home Valuation Report is an in-depth analysis detailing your home's value as well as a comparison with similar homes in the area
Home Values in the Area
Average Home Value in this Area
Purchase History
| Date | Buyer | Sale Price | Title Company |
|---|---|---|---|
| Nadim Jamal Ret | -- | -- | |
| Nadim Jamal Ret | -- | -- | |
| Jamal Nadim | $120,935 | -- | |
| Jamal Nadim | $120,935 | -- |
Source: Public Records
Mortgage History
| Date | Status | Borrower | Loan Amount |
|---|---|---|---|
| Previous Owner | Jamal Nadim | $20,000 | |
| Previous Owner | Jamal Nadim | $107,000 | |
| Previous Owner | Jamal Nadim | $108,000 |
Source: Public Records
Tax History Compared to Growth
Tax History
| Year | Tax Paid | Tax Assessment Tax Assessment Total Assessment is a certain percentage of the fair market value that is determined by local assessors to be the total taxable value of land and additions on the property. | Land | Improvement |
|---|---|---|---|---|
| 2025 | $4,004 | $682,100 | $296,500 | $385,600 |
| 2024 | $3,831 | $610,000 | $258,100 | $351,900 |
| 2023 | $3,515 | $507,900 | $206,500 | $301,400 |
| 2022 | $3,664 | $455,200 | $193,100 | $262,100 |
| 2021 | $3,505 | $412,300 | $193,100 | $219,200 |
| 2020 | $3,390 | $394,700 | $175,500 | $219,200 |
| 2019 | $3,278 | $382,900 | $175,500 | $207,400 |
| 2018 | $3,198 | $371,900 | $175,500 | $196,400 |
| 2017 | $3,113 | $365,000 | $175,500 | $189,500 |
| 2016 | $3,055 | $365,000 | $175,500 | $189,500 |
| 2015 | $2,989 | $365,000 | $175,500 | $189,500 |
| 2014 | $2,969 | $364,300 | $175,600 | $188,700 |
Source: Public Records
Map
Nearby Homes