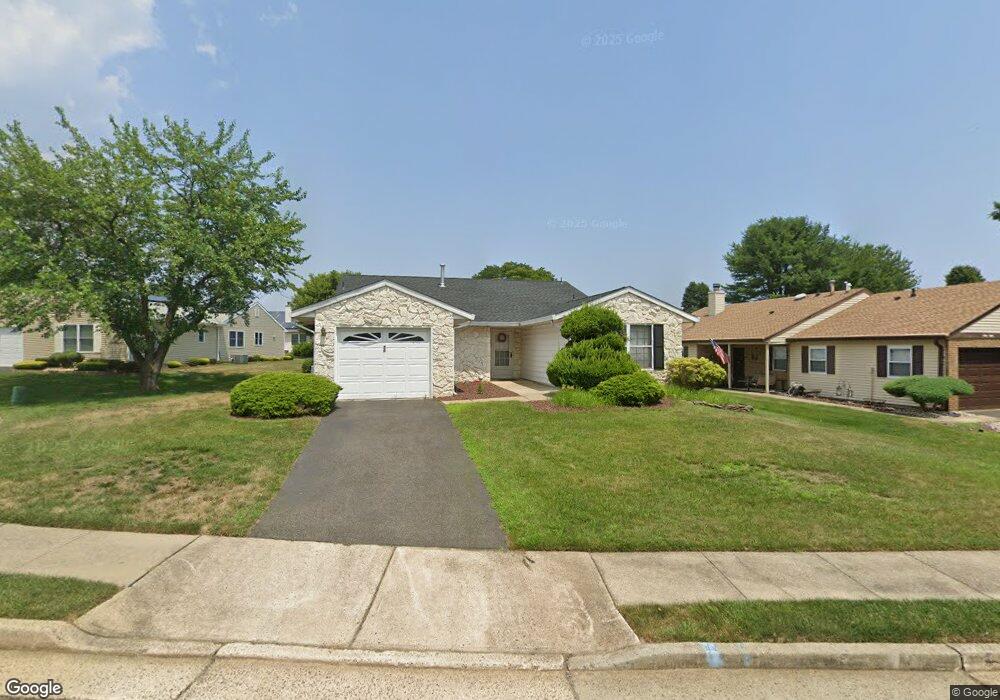
70 Suffolk Way Marlboro, NJ 07746
Estimated Value: $533,000 - $607,639
2
Beds
2
Baths
1,686
Sq Ft
$344/Sq Ft
Est. Value
About This Home
This home is located at 70 Suffolk Way, Marlboro, NJ 07746 and is currently estimated at $579,410, approximately $343 per square foot. 70 Suffolk Way is a home located in Monmouth County with nearby schools including Frank J. Dugan Elementary School, Marlboro Middle School, and Marlboro High School.
Ownership History
Date
Name
Owned For
Owner Type
Purchase Details
Closed on
Sep 20, 2017
Sold by
Gulino Rosemarie
Bought by
Simonetti Michael and Simonetti Christina
Current Estimated Value
Home Financials for this Owner
Home Financials are based on the most recent Mortgage that was taken out on this home.
Original Mortgage
$223,200
Outstanding Balance
$186,187
Interest Rate
3.86%
Mortgage Type
New Conventional
Estimated Equity
$393,223
Purchase Details
Closed on
Sep 7, 1990
Bought by
Gulino Rosemarie
Create a Home Valuation Report for This Property
The Home Valuation Report is an in-depth analysis detailing your home's value as well as a comparison with similar homes in the area
Home Values in the Area
Average Home Value in this Area
Purchase History
| Date | Buyer | Sale Price | Title Company |
|---|---|---|---|
| Simonetti Michael | $279,000 | Old Republic Title | |
| Gulino Rosemarie | $160,000 | -- |
Source: Public Records
Mortgage History
| Date | Status | Borrower | Loan Amount |
|---|---|---|---|
| Open | Simonetti Michael | $223,200 |
Source: Public Records
Tax History Compared to Growth
Tax History
| Year | Tax Paid | Tax Assessment Tax Assessment Total Assessment is a certain percentage of the fair market value that is determined by local assessors to be the total taxable value of land and additions on the property. | Land | Improvement |
|---|---|---|---|---|
| 2025 | $6,841 | $274,300 | $122,700 | $151,600 |
| 2024 | $6,539 | $274,300 | $122,700 | $151,600 |
| 2023 | $6,539 | $274,300 | $122,700 | $151,600 |
| 2022 | $6,372 | $274,300 | $122,700 | $151,600 |
| 2021 | $6,309 | $274,300 | $122,700 | $151,600 |
| 2020 | $6,306 | $274,300 | $122,700 | $151,600 |
| 2019 | $6,309 | $274,300 | $122,700 | $151,600 |
| 2018 | $6,202 | $274,300 | $122,700 | $151,600 |
| 2017 | $6,081 | $274,300 | $122,700 | $151,600 |
| 2016 | $6,057 | $274,300 | $122,700 | $151,600 |
| 2015 | $5,729 | $263,400 | $115,700 | $147,700 |
| 2014 | $5,095 | $231,800 | $100,700 | $131,100 |
Source: Public Records
Map
Nearby Homes
- 26 Lansdale Dr
- 41 Lakeview Dr
- 10 Surray Ct
- 29 Coventry Terrace
- 69 Caldwell Terrace
- 11 Whistler Way
- 41 Livingston Ln
- 25 Whistler Way
- 39 Longstreet Rd
- 39 Homestead Cir
- 41 Longstreet Rd
- 62 Murray Hill Terrace
- 72 Murray Hill Terrace
- 87 Murray Hill Terrace
- 4 Terrace Dr
- 107 Clubhouse Ln
- 97 Tangerine Dr
- 102 Murray Hill Terrace
- 254 Plum Dr
- 20 Silvers Rd