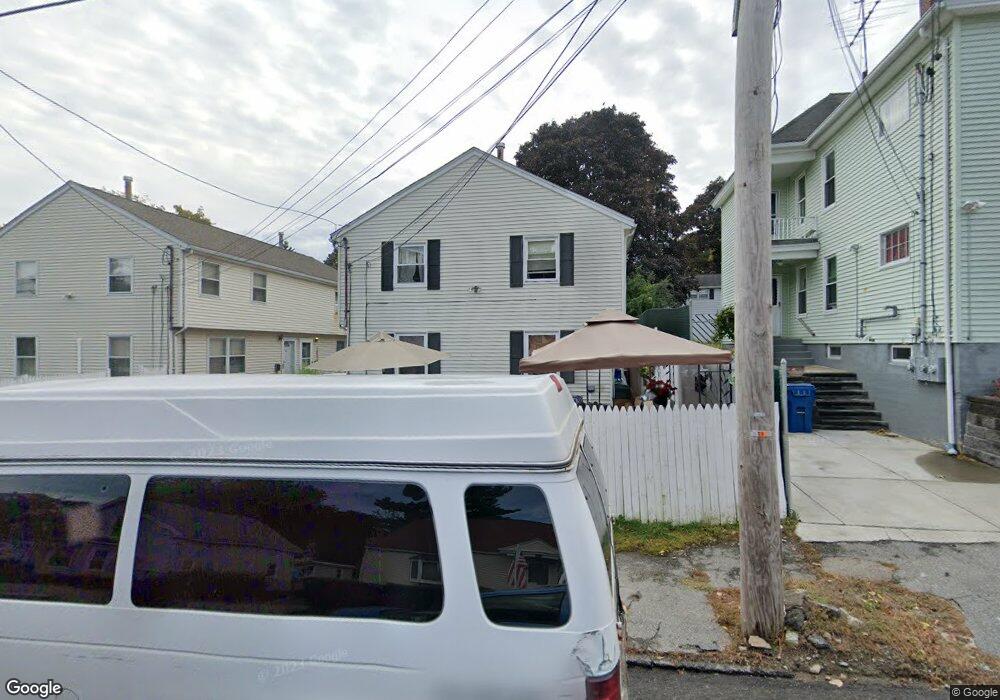
70 Sylvester St Unit 72 Lawrence, MA 01843
Mount Vernon NeighborhoodEstimated Value: $635,000 - $742,000
4
Beds
3
Baths
2,288
Sq Ft
$299/Sq Ft
Est. Value
About This Home
This home is located at 70 Sylvester St Unit 72, Lawrence, MA 01843 and is currently estimated at $684,988, approximately $299 per square foot. 70 Sylvester St Unit 72 is a home located in Essex County with nearby schools including Olive Branch Elementary School, John Breen School, and School For Exceptional Studies.
Ownership History
Date
Name
Owned For
Owner Type
Purchase Details
Closed on
Jan 13, 2020
Sold by
Issa Jenniffer
Bought by
Yssa Debora
Current Estimated Value
Purchase Details
Closed on
Apr 6, 2012
Sold by
Yssa Debora and Issa Jenniffer
Bought by
Issa Jenniffer
Home Financials for this Owner
Home Financials are based on the most recent Mortgage that was taken out on this home.
Original Mortgage
$77,600
Interest Rate
3.95%
Mortgage Type
New Conventional
Purchase Details
Closed on
Jun 4, 2010
Sold by
Henriquez Bienvendia A and Issa Jennifer
Bought by
Yssa Debora and Issa Jennifer
Purchase Details
Closed on
Sep 14, 2006
Sold by
Henriquez Bienvenida A
Bought by
Henriquez Bienvenida and Yssa Debora
Purchase Details
Closed on
Jun 10, 1999
Sold by
Patel Hasmukh P
Bought by
Henriquez Bienvenida A
Home Financials for this Owner
Home Financials are based on the most recent Mortgage that was taken out on this home.
Original Mortgage
$80,750
Interest Rate
6.9%
Mortgage Type
Purchase Money Mortgage
Create a Home Valuation Report for This Property
The Home Valuation Report is an in-depth analysis detailing your home's value as well as a comparison with similar homes in the area
Home Values in the Area
Average Home Value in this Area
Purchase History
| Date | Buyer | Sale Price | Title Company |
|---|---|---|---|
| Yssa Debora | -- | None Available | |
| Issa Jenniffer | -- | -- | |
| Yssa Debora | -- | -- | |
| Henriquez Bienvenida | -- | -- | |
| Henriquez Bienvenida A | $85,000 | -- |
Source: Public Records
Mortgage History
| Date | Status | Borrower | Loan Amount |
|---|---|---|---|
| Previous Owner | Henriquez Bienvenida A | $77,600 | |
| Previous Owner | Henriquez Bienvenida A | $80,750 | |
| Previous Owner | Henriquez Bienvenida A | $115,500 | |
| Closed | Henriquez Bienvenida A | $2,550 |
Source: Public Records
Tax History Compared to Growth
Tax History
| Year | Tax Paid | Tax Assessment Tax Assessment Total Assessment is a certain percentage of the fair market value that is determined by local assessors to be the total taxable value of land and additions on the property. | Land | Improvement |
|---|---|---|---|---|
| 2025 | $5,094 | $578,900 | $137,000 | $441,900 |
| 2024 | $4,836 | $522,800 | $115,700 | $407,100 |
| 2023 | $4,714 | $464,000 | $103,100 | $360,900 |
| 2022 | $4,382 | $383,000 | $95,800 | $287,200 |
| 2021 | $4,287 | $349,400 | $93,600 | $255,800 |
| 2020 | $3,761 | $302,600 | $81,000 | $221,600 |
| 2019 | $4,021 | $293,900 | $80,800 | $213,100 |
| 2018 | $3,829 | $267,400 | $77,200 | $190,200 |
| 2017 | $3,714 | $242,100 | $76,500 | $165,600 |
| 2016 | $3,586 | $231,200 | $70,800 | $160,400 |
| 2015 | $3,323 | $219,800 | $70,800 | $149,000 |
Source: Public Records
Map
Nearby Homes
- 102 Weare St
- 437 N Main St Unit C
- 34 Leeds Terrace
- 5 Lafayette Ave
- 5 W Kenneth St
- 24 Inman St Unit 32
- 11 W Hawley St
- 33 Jefferson St
- 6 Windsor St
- 5 Marc Ln
- 42 Beresford St
- 10 Martingale Ln Unit 10
- 59 William St
- 21 Clubview Dr Unit 21
- 24 York St
- 15 Beaconsfield St
- 96 Beacon St
- 27-29 Dorchester St
- 54 Amherst St
- 49 Bowdoin St Unit 51
- 70-72 Sylvester St
- 68 Sylvester St
- 66 Sylvester St
- 68 Sylvester St Unit 1
- 74 Sylvester St Unit 76
- 80 Sylvester St
- 9 Mckenney Cir
- 7 Mckenney Cir
- 64 Sylvester St
- 97 Sylvester St
- 79 Sylvester St
- 101 Sylvester St
- 75 Sylvester St
- 11 Mckenney Cir
- 105 Sylvester St
- 61 Sylvester St
- 60 Sylvester St
- 5 Mckenney Cir
- 80 Gilbert St
- 84 Gilbert St