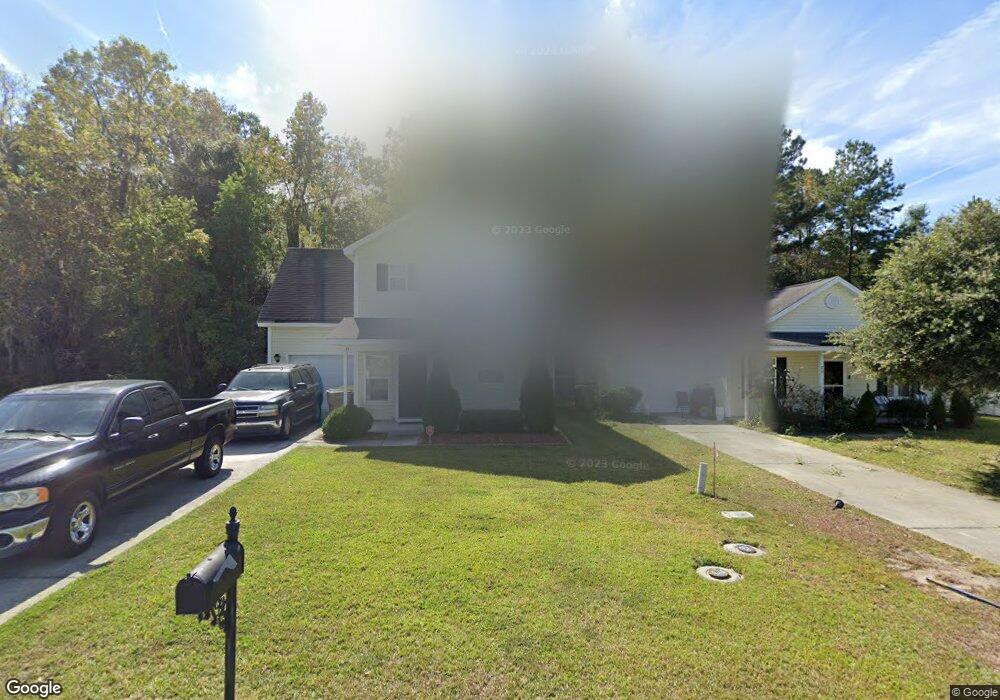
70 Tiller Way Port Wentworth, GA 31407
Estimated Value: $273,000 - $287,000
3
Beds
3
Baths
1,584
Sq Ft
$178/Sq Ft
Est. Value
About This Home
This home is located at 70 Tiller Way, Port Wentworth, GA 31407 and is currently estimated at $281,478, approximately $177 per square foot. 70 Tiller Way is a home located in Chatham County with nearby schools including Rice Creek K-8 School and Groves High School.
Ownership History
Date
Name
Owned For
Owner Type
Purchase Details
Closed on
Dec 3, 2009
Sold by
Kirsch Custom Homes Inc
Bought by
Gadson Eldridge D
Current Estimated Value
Home Financials for this Owner
Home Financials are based on the most recent Mortgage that was taken out on this home.
Original Mortgage
$139,066
Outstanding Balance
$88,013
Interest Rate
5.01%
Mortgage Type
New Conventional
Estimated Equity
$193,465
Purchase Details
Closed on
Nov 12, 2009
Sold by
Caran Properties Llc
Bought by
Kirsch Custom Homes Inc
Home Financials for this Owner
Home Financials are based on the most recent Mortgage that was taken out on this home.
Original Mortgage
$139,066
Outstanding Balance
$88,013
Interest Rate
5.01%
Mortgage Type
New Conventional
Estimated Equity
$193,465
Purchase Details
Closed on
Jun 18, 2009
Sold by
New City Development Llc
Bought by
Caran Properties Llc
Purchase Details
Closed on
Jul 14, 2005
Sold by
Not Provided
Bought by
Gadson Eldridge D
Create a Home Valuation Report for This Property
The Home Valuation Report is an in-depth analysis detailing your home's value as well as a comparison with similar homes in the area
Home Values in the Area
Average Home Value in this Area
Purchase History
| Date | Buyer | Sale Price | Title Company |
|---|---|---|---|
| Gadson Eldridge D | $136,285 | -- | |
| Kirsch Custom Homes Inc | -- | -- | |
| Caran Properties Llc | -- | -- | |
| Gadson Eldridge D | $555,300 | -- |
Source: Public Records
Mortgage History
| Date | Status | Borrower | Loan Amount |
|---|---|---|---|
| Open | Gadson Eldridge D | $139,066 |
Source: Public Records
Tax History Compared to Growth
Tax History
| Year | Tax Paid | Tax Assessment Tax Assessment Total Assessment is a certain percentage of the fair market value that is determined by local assessors to be the total taxable value of land and additions on the property. | Land | Improvement |
|---|---|---|---|---|
| 2025 | $2,402 | $111,320 | $20,000 | $91,320 |
| 2024 | $2,402 | $99,560 | $18,000 | $81,560 |
| 2023 | $1,620 | $92,720 | $18,000 | $74,720 |
| 2022 | $1,947 | $75,320 | $8,000 | $67,320 |
| 2021 | $1,939 | $65,280 | $8,000 | $57,280 |
| 2020 | $1,741 | $63,560 | $8,000 | $55,560 |
| 2019 | $1,741 | $55,440 | $8,000 | $47,440 |
| 2018 | $1,698 | $53,560 | $8,000 | $45,560 |
| 2017 | $1,590 | $53,800 | $8,000 | $45,800 |
| 2016 | $1,336 | $46,040 | $8,000 | $38,040 |
| 2015 | $1,354 | $46,520 | $8,000 | $38,520 |
| 2014 | $1,917 | $45,160 | $0 | $0 |
Source: Public Records
Map
Nearby Homes
- 7 Corsair Cir
- 33 Gimbal Cir
- 26 Halyard Dr
- 21 Hawser Way
- 24 Transom Rd
- 15 Newport Blvd
- 19 Halyard Dr
- 32 Transom Rd
- 58 Bearing Cir Unit B
- 56 Bearing Cir
- 10 Binnacle Ln
- 629 & 631 Meinhard Rd
- 11 Cordage Cir
- 1 Braxton Manor Dr
- 44 Braxton Manor Dr
- 42 Braxton Manor Dr
- 15 Amber Dr
- 22 Roseberry Cir
- 177 Fox Glen Ct
- 167 Fox Glen Ct