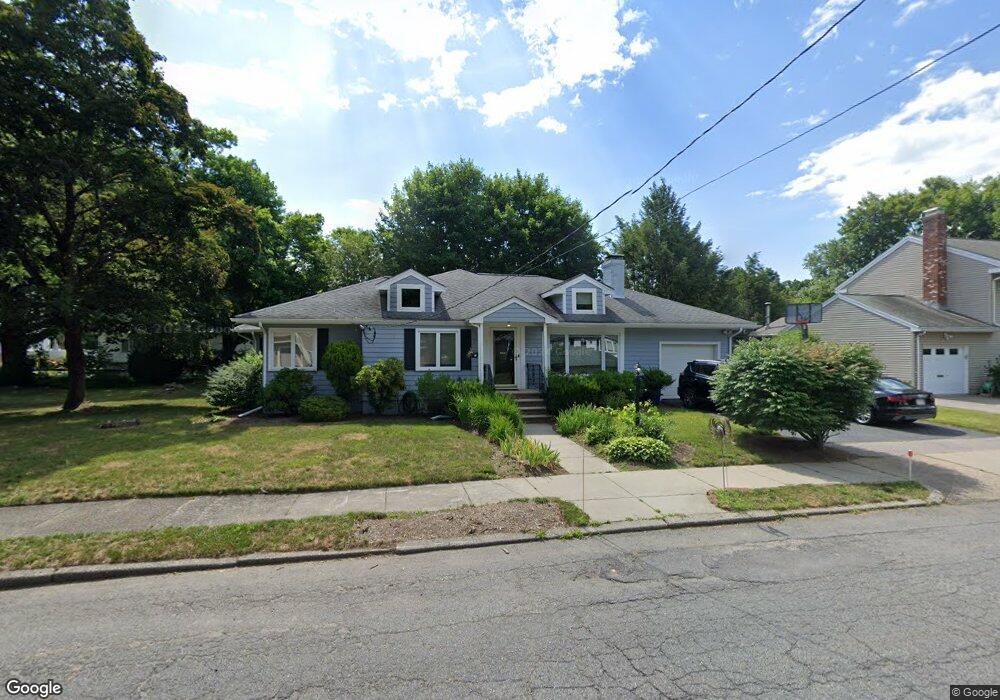
70 Truman Rd Newton Center, MA 02459
Newton Highlands NeighborhoodEstimated Value: $1,209,000 - $1,567,000
4
Beds
2
Baths
2,117
Sq Ft
$677/Sq Ft
Est. Value
About This Home
This home is located at 70 Truman Rd, Newton Center, MA 02459 and is currently estimated at $1,432,298, approximately $676 per square foot. 70 Truman Rd is a home located in Middlesex County with nearby schools including Countryside Elementary School, Charles E Brown Middle School, and Newton South High School.
Ownership History
Date
Name
Owned For
Owner Type
Purchase Details
Closed on
Nov 25, 2024
Sold by
Cheteoui Barbara J and Cheteoui Joseph S
Bought by
Barbara Cheteoui T and Barbara Cheteoui
Current Estimated Value
Purchase Details
Closed on
Aug 28, 1989
Sold by
Shulman Mildred
Bought by
Cheteoui Joseph S
Create a Home Valuation Report for This Property
The Home Valuation Report is an in-depth analysis detailing your home's value as well as a comparison with similar homes in the area
Home Values in the Area
Average Home Value in this Area
Purchase History
| Date | Buyer | Sale Price | Title Company |
|---|---|---|---|
| Barbara Cheteoui T | -- | None Available | |
| Barbara Cheteoui T | -- | None Available | |
| Cheteoui Joseph S | $224,000 | -- | |
| Cheteoui Joseph S | $224,000 | -- |
Source: Public Records
Mortgage History
| Date | Status | Borrower | Loan Amount |
|---|---|---|---|
| Previous Owner | Cheteoui Joseph S | $240,000 | |
| Previous Owner | Cheteoui Joseph S | $160,000 | |
| Previous Owner | Cheteoui Joseph S | $50,000 |
Source: Public Records
Tax History Compared to Growth
Tax History
| Year | Tax Paid | Tax Assessment Tax Assessment Total Assessment is a certain percentage of the fair market value that is determined by local assessors to be the total taxable value of land and additions on the property. | Land | Improvement |
|---|---|---|---|---|
| 2025 | $11,915 | $1,215,800 | $915,400 | $300,400 |
| 2024 | $11,521 | $1,180,400 | $888,700 | $291,700 |
| 2023 | $10,884 | $1,069,200 | $679,000 | $390,200 |
| 2022 | $10,415 | $990,000 | $628,700 | $361,300 |
| 2021 | $10,050 | $934,000 | $593,100 | $340,900 |
| 2020 | $9,007 | $862,700 | $593,100 | $269,600 |
| 2019 | $8,753 | $837,600 | $575,800 | $261,800 |
| 2018 | $8,308 | $767,800 | $522,400 | $245,400 |
| 2017 | $8,054 | $724,300 | $492,800 | $231,500 |
| 2016 | $7,703 | $676,900 | $460,600 | $216,300 |
| 2015 | $7,344 | $632,600 | $430,500 | $202,100 |
Source: Public Records
Map
Nearby Homes
- 250 Woodcliff Rd
- 19 Selwyn Rd
- 36 Cannon St
- 45 Brandeis Rd
- 35 Haynes Rd
- 21 Philbrick Rd
- 125 Oakdale Rd
- 628 Boylston St
- 1308 Walnut St
- 671 Boylston St
- 15 Buff Cir
- 1292 Walnut St
- 625 Boylston St
- 415 Dedham St Unit D
- 42 Sunhill Ln
- 58 Country Club Rd
- 116 Upland Ave
- 65 Levbert Rd
- 5 Halcyon Rd
- 85 Dudley Rd