Estimated Value: $244,000 - $321,000
3
Beds
2
Baths
2,122
Sq Ft
$125/Sq Ft
Est. Value
About This Home
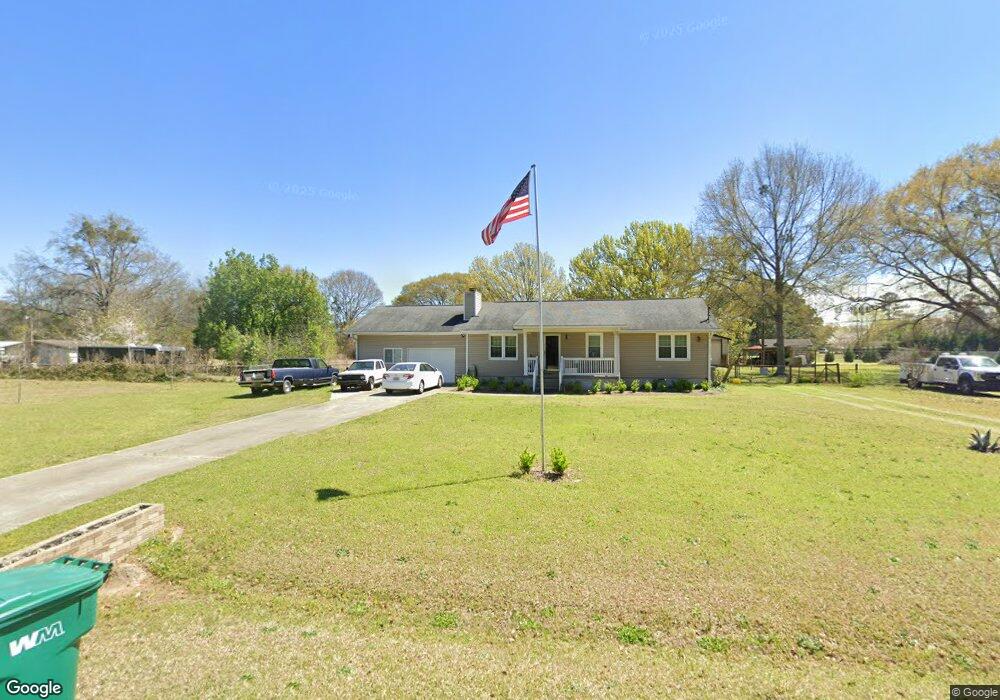
This home is located at 70 Tucker Rd, Byron, GA 31008 and is currently estimated at $266,235, approximately $125 per square foot. 70 Tucker Rd is a home located in Peach County with nearby schools including Byron Elementary School, Byron Middle School, and Peach County High School.
Ownership History
Date
Name
Owned For
Owner Type
Purchase Details
Closed on
Feb 23, 2015
Sold by
Washko Michael A
Bought by
Washko Darrel
Current Estimated Value
Home Financials for this Owner
Home Financials are based on the most recent Mortgage that was taken out on this home.
Original Mortgage
$105,000
Outstanding Balance
$57,848
Interest Rate
3.74%
Mortgage Type
New Conventional
Estimated Equity
$208,387
Purchase Details
Closed on
Feb 14, 2011
Sold by
Washko Michael and Washko Frany A
Bought by
Washko Michael and Washko Frany A
Purchase Details
Closed on
Nov 2, 2004
Sold by
Allen Hayward E and Allen Deborah H
Bought by
Washko Michael and Washko Frany A
Purchase Details
Closed on
Jan 14, 1986
Bought by
Allen Hayward E and Allen Deborah H
Purchase Details
Closed on
Apr 11, 1985
Bought by
Pyles J A
Create a Home Valuation Report for This Property
The Home Valuation Report is an in-depth analysis detailing your home's value as well as a comparison with similar homes in the area
Home Values in the Area
Average Home Value in this Area
Purchase History
| Date | Buyer | Sale Price | Title Company |
|---|---|---|---|
| Washko Darrel | -- | -- | |
| Washko Michael | -- | -- | |
| Washko Michael | $107,500 | -- | |
| Allen Hayward E | $49,900 | -- | |
| Pyles J A | -- | -- |
Source: Public Records
Mortgage History
| Date | Status | Borrower | Loan Amount |
|---|---|---|---|
| Open | Washko Darrel | $105,000 |
Source: Public Records
Tax History
| Year | Tax Paid | Tax Assessment Tax Assessment Total Assessment is a certain percentage of the fair market value that is determined by local assessors to be the total taxable value of land and additions on the property. | Land | Improvement |
|---|---|---|---|---|
| 2025 | $2,332 | $82,208 | $6,280 | $75,928 |
| 2024 | $2,199 | $74,768 | $6,200 | $68,568 |
| 2023 | $2,275 | $76,928 | $4,960 | $71,968 |
| 2022 | $1,966 | $65,464 | $4,960 | $60,504 |
| 2021 | $1,947 | $55,836 | $4,960 | $50,876 |
| 2020 | $1,954 | $56,052 | $4,960 | $51,092 |
| 2019 | $1,963 | $56,052 | $4,960 | $51,092 |
| 2018 | $1,972 | $56,052 | $4,960 | $51,092 |
| 2017 | $1,980 | $56,052 | $4,960 | $51,092 |
| 2016 | $1,673 | $46,560 | $4,960 | $41,600 |
| 2015 | -- | $46,560 | $4,960 | $41,600 |
| 2014 | $1,678 | $46,560 | $4,960 | $41,600 |
| 2013 | -- | $46,560 | $4,960 | $41,600 |
Source: Public Records
Map
Nearby Homes
- 209 Williamsburg Trail
- 103 Bellamy Way
- 103 Bellamy Way Unit LOT E7
- 104 Robinson St
- 109 Silver Maple Ct
- 107 Silver Maple Ct
- 467 Kirkland Dr
- 204 Sugar Maple Ct
- 102 Silver Maple Ct
- 506 Howard St
- 711 Main St
- 110 Pine Crest Dr
- 104 Howard St
- 79 N Peach Plantations Ct
- 101 Fawn Ct
- 103 Fawn Ct
- 00 Rum Rd
- 122 Shadow Lawn Dr
- 111 Collins St
- 108 Timber Ridge Cir
- 46 Tucker Rd
- 100 Tucker Rd
- 22 Tucker Rd
- 975 Boy Scout Rd
- 616 Boy Scout Rd
- 25 Tucker Rd
- 111 Tucker Rd
- 108 Tucker Rd
- 106 Williamsburg Trail
- 108 Williamsburg Trail
- 151 Tucker Rd
- 535 Boy Scout Rd
- 184 Tucker Rd
- 927 Boy Scout Rd
- 110 Williamsburg Trail
- 533 Boy Scout Rd
- 187 Tucker Rd
- 201 Colonial Dr
- 206 Tucker Rd
- 206 Tucker Rd Unit 9A&10
Your Personal Tour Guide
Ask me questions while you tour the home.