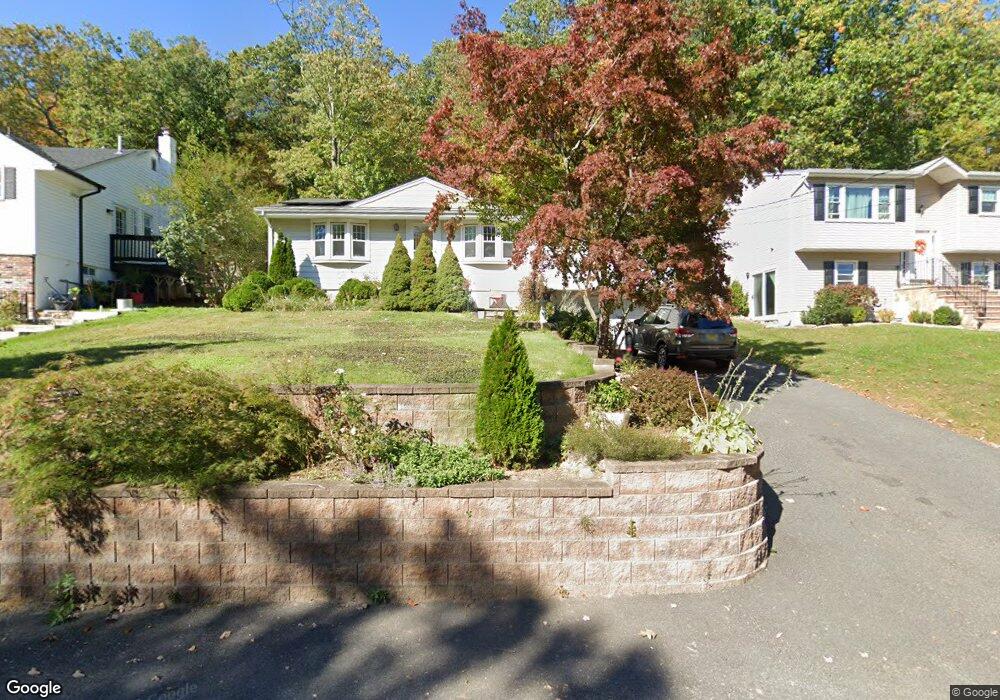
70 Valley View Dr Rockaway, NJ 07866
Estimated Value: $473,000 - $572,000
--
Bed
--
Bath
1,132
Sq Ft
$452/Sq Ft
Est. Value
About This Home
This home is located at 70 Valley View Dr, Rockaway, NJ 07866 and is currently estimated at $511,832, approximately $452 per square foot. 70 Valley View Dr is a home located in Morris County with nearby schools including Stony Brook School, Copeland Middle School, and Divine Mercy Academy.
Ownership History
Date
Name
Owned For
Owner Type
Purchase Details
Closed on
Jan 2, 2006
Sold by
Legiuez Raymond A
Bought by
Treiber Victor and Treiber Joanne S
Current Estimated Value
Home Financials for this Owner
Home Financials are based on the most recent Mortgage that was taken out on this home.
Original Mortgage
$280,000
Interest Rate
5.86%
Mortgage Type
New Conventional
Purchase Details
Closed on
Feb 21, 2001
Sold by
Ludwig Dale L and Ludwig Nancie O
Bought by
Lejuez Raymond A and Nemeth Denise
Home Financials for this Owner
Home Financials are based on the most recent Mortgage that was taken out on this home.
Original Mortgage
$158,000
Interest Rate
7.15%
Purchase Details
Closed on
Jun 18, 1998
Sold by
Tepper Robert and Tepper Elaine
Bought by
Ludwig Dale L and Ludwig Nancie O
Home Financials for this Owner
Home Financials are based on the most recent Mortgage that was taken out on this home.
Original Mortgage
$158,947
Interest Rate
7.09%
Mortgage Type
FHA
Create a Home Valuation Report for This Property
The Home Valuation Report is an in-depth analysis detailing your home's value as well as a comparison with similar homes in the area
Home Values in the Area
Average Home Value in this Area
Purchase History
| Date | Buyer | Sale Price | Title Company |
|---|---|---|---|
| Treiber Victor | $360,000 | -- | |
| Lejuez Raymond A | $208,000 | Fidelity National Title Ins | |
| Ludwig Dale L | $161,000 | -- |
Source: Public Records
Mortgage History
| Date | Status | Borrower | Loan Amount |
|---|---|---|---|
| Closed | Treiber Victor | $280,000 | |
| Previous Owner | Lejuez Raymond A | $158,000 | |
| Previous Owner | Ludwig Dale L | $158,947 |
Source: Public Records
Tax History Compared to Growth
Tax History
| Year | Tax Paid | Tax Assessment Tax Assessment Total Assessment is a certain percentage of the fair market value that is determined by local assessors to be the total taxable value of land and additions on the property. | Land | Improvement |
|---|---|---|---|---|
| 2025 | $8,807 | $383,100 | $234,300 | $148,800 |
| 2024 | $8,405 | $343,500 | $202,900 | $140,600 |
| 2023 | $8,405 | $320,300 | $187,300 | $133,000 |
| 2022 | $7,352 | $293,400 | $166,500 | $126,900 |
| 2021 | $7,352 | $270,400 | $149,000 | $121,400 |
| 2020 | $7,674 | $270,100 | $151,500 | $118,600 |
| 2019 | $7,506 | $263,100 | $146,500 | $116,600 |
| 2018 | $7,448 | $256,900 | $145,100 | $111,800 |
| 2017 | $7,705 | $246,800 | $133,800 | $113,000 |
| 2016 | $7,606 | $246,800 | $133,800 | $113,000 |
| 2015 | $7,552 | $246,800 | $133,800 | $113,000 |
| 2014 | $7,411 | $246,800 | $133,800 | $113,000 |
Source: Public Records
Map
Nearby Homes
- 1512 Parkview Ln
- 1310 Parkview Ln
- 61B Norman Rd
- 26 Comanche Ave
- 8 Rebecca Ln
- 51 Mountain Ave
- 25 Mohawk Ave
- 71 White Meadow Rd
- 11 Oswego Ave
- 53 White Meadow Rd
- 51 Sioux Ave
- 8 Ellen Dr
- 7 Oakland Ave
- 69 Kitchell Rd
- 41 Seneca Ave
- 40 Miami Trail
- 11 Oneida Ave
- 12 Apache Trail
- 19 Algonquin Ave
- 59 W Lake Shore Dr
- 72 Valley View Dr
- 68 Valley View Dr
- 74 Valley View Dr
- 46 Valley View Dr
- 183 Valley View Dr
- 76 Valley View Dr
- 64 Valley View Dr
- 78 Valley View Dr
- 71 Valley View Dr
- 62 Valley View Dr
- 73 Valley View Dr
- 80 Valley View Dr
- 75 Valley View Dr
- 66 Valley View Dr
- 60 Valley View Dr
- 79 Valley View Dr
- 59 Valley View Dr
- 54 Sherbrook Dr
- 81 Valley View Dr
- 84 Valley View Dr