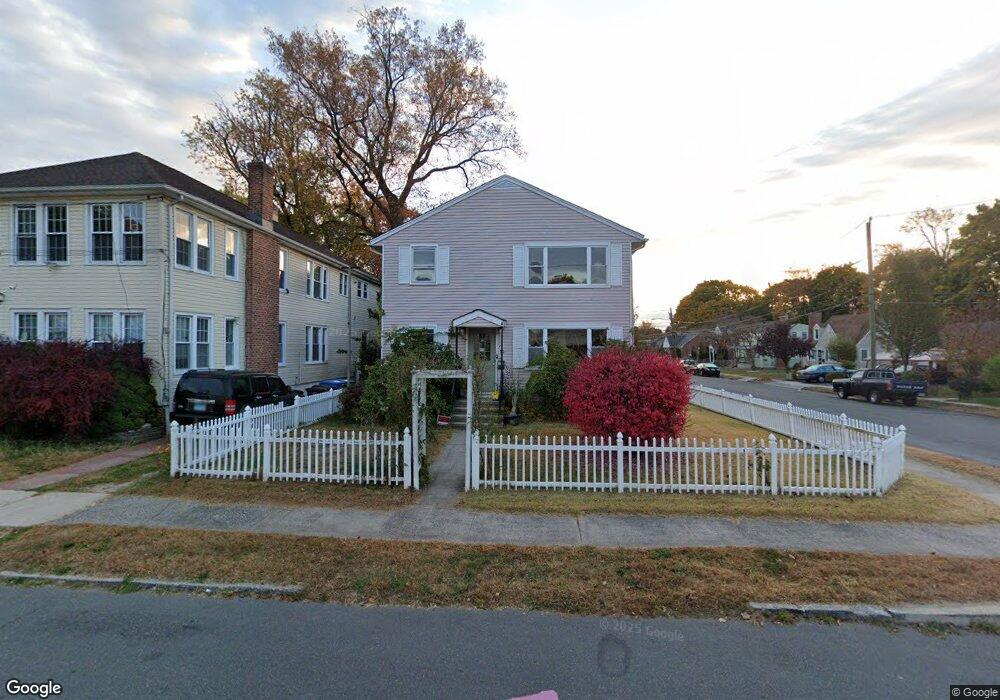
70 Vance St New Britain, CT 06052
Estimated Value: $328,666 - $415,000
3
Beds
1
Bath
2,422
Sq Ft
$153/Sq Ft
Est. Value
About This Home
This home is located at 70 Vance St, New Britain, CT 06052 and is currently estimated at $370,417, approximately $152 per square foot. 70 Vance St is a home located in Hartford County with nearby schools including Vance School, Slade Middle School, and Raymond Hill School.
Ownership History
Date
Name
Owned For
Owner Type
Purchase Details
Closed on
May 8, 2023
Sold by
Sansaverino John and Sansaverino Immacolata
Bought by
Parker Connor M
Current Estimated Value
Home Financials for this Owner
Home Financials are based on the most recent Mortgage that was taken out on this home.
Original Mortgage
$198,750
Outstanding Balance
$192,721
Interest Rate
6.32%
Mortgage Type
Purchase Money Mortgage
Estimated Equity
$177,696
Purchase Details
Closed on
Dec 12, 2011
Sold by
Sansaverino John
Bought by
Sansaverino John and Sansaverino Immacolata
Purchase Details
Closed on
Aug 2, 1999
Sold by
Fnma
Bought by
Gonzalez Ocar and Gonzalez Justina
Home Financials for this Owner
Home Financials are based on the most recent Mortgage that was taken out on this home.
Original Mortgage
$93,231
Interest Rate
7.61%
Mortgage Type
Purchase Money Mortgage
Create a Home Valuation Report for This Property
The Home Valuation Report is an in-depth analysis detailing your home's value as well as a comparison with similar homes in the area
Home Values in the Area
Average Home Value in this Area
Purchase History
| Date | Buyer | Sale Price | Title Company |
|---|---|---|---|
| Parker Connor M | $265,000 | None Available | |
| Sansaverino John | -- | -- | |
| Sansaverino John | $130,000 | -- | |
| Gonzalez Ocar | $94,000 | -- |
Source: Public Records
Mortgage History
| Date | Status | Borrower | Loan Amount |
|---|---|---|---|
| Open | Parker Connor M | $198,750 | |
| Previous Owner | Gonzalez Ocar | $179,900 | |
| Previous Owner | Gonzalez Ocar | $132,800 | |
| Previous Owner | Gonzalez Ocar | $93,231 |
Source: Public Records
Tax History Compared to Growth
Tax History
| Year | Tax Paid | Tax Assessment Tax Assessment Total Assessment is a certain percentage of the fair market value that is determined by local assessors to be the total taxable value of land and additions on the property. | Land | Improvement |
|---|---|---|---|---|
| 2025 | $7,400 | $188,860 | $41,580 | $147,280 |
| 2024 | $6,920 | $174,790 | $41,580 | $133,210 |
| 2023 | $6,691 | $174,790 | $41,580 | $133,210 |
| 2022 | $5,956 | $120,330 | $19,110 | $101,220 |
| 2021 | $5,956 | $120,330 | $19,110 | $101,220 |
| 2020 | $6,077 | $120,330 | $19,110 | $101,220 |
| 2019 | $6,077 | $120,330 | $19,110 | $101,220 |
| 2018 | $6,077 | $120,330 | $19,110 | $101,220 |
| 2017 | $5,861 | $116,060 | $17,570 | $98,490 |
| 2016 | $5,861 | $116,060 | $17,570 | $98,490 |
| 2015 | $5,687 | $116,060 | $17,570 | $98,490 |
| 2014 | $5,687 | $116,060 | $17,570 | $98,490 |
Source: Public Records
Map
Nearby Homes
- 256 Hart St
- 73 Brooklawn St
- 423 Monroe St
- 100 Shuttle Meadow Ave
- 300 Lincoln St
- 93 Winthrop St
- 212 Lincoln St
- 30 Norden St
- 112 Lincoln St
- 17 Kensington Ave
- 70 Monroe St
- 66 Lincoln St
- 45 Park Place Unit 205
- 239 Glen St Unit 2A
- 300 W Main St
- 14 Park Place Unit 4
- 96 Garden St
- 565 Lincoln St
- 235 W Main St
- 60 Prospect St
- 70 Vance St Unit 2
- 62 Vance St
- 58 Vance St Unit 60
- 219 Columbia St
- 76 Vance St Unit 78
- 54 Vance St
- 213 Columbia St
- 84 Vance St
- 218 Columbia St
- 67 Vance St
- 63 Vance St
- 73 Vance St
- 57 Vance St
- 209 Columbia St
- 79 Vance St
- 48 Vance St
- 214 Columbia St
- 214 Columbia St Unit 2nd Floor
- 214 Columbia St Unit 1st Floor
- 55 Vance St