NOT LISTED FOR SALE

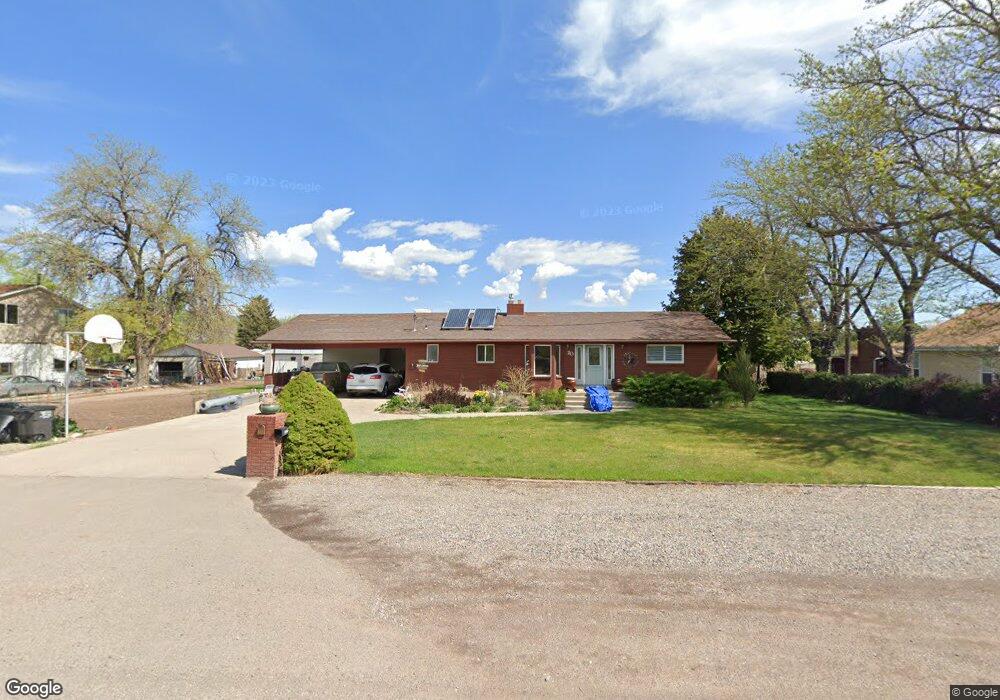
70 W 400 N Monroe, UT 84754

Estimated Value: $382,652 - $418,000

-- Bed
1 Bath
1,450 Sq Ft
$279/Sq Ft Est. Value

About This Home

This home is located at 70 W 400 N, Monroe, UT 84754 and is currently estimated at $404,663, approximately $279 per square foot. 70 W 400 N is a home located in Sevier County with nearby schools including Monroe School, South Sevier Middle School, and South Sevier High School.

Range of Values:

Collateral Analytics

Collateral Analytics Collateral Analytics AVMs (Automated Valuation Model) employ a number of statistical approaches combined with neighborhood-specific comparable selection guarantees the most up-to-date and precise valuations.

Not Available

Collateral Analytics does not have data for the current month. Please view the chart for historical values.

ICE

ICE Mortgage Technology ICE Mortgage Technology’s AVM (Automated Valuation Model) is a state-of-the-art online residential property valuation tool that provides a quick and accurate estimate of the value of almost any home in the U.S.

Not Available

ICE Mortgage Technology does not have data for the current month. Please view the chart for historical values.

First American

First American First American Data & Analytics’ next-generation AVM combines unrivaled data assets with a blended ensemble of valuation models to produce highly accurate, reliable valuations you can trust.

Not Available

First American does not have data for the current month. Please view the chart for historical values.

Quantarium

Quantarium Quantarium’s valuation service, repeatedly proven the industry’s most accurate and comprehensive, is supercharged with a self-learning and auto-tuning AI engine that continually becomes smarter and more accurate as it processes daily inputs from the industry’s leading RE data lake.

Not Available

Quantarium does not have data for the current month. Please view the chart for historical values.

Average Value
Not Available
List Price
Sold Price
Create a Home Valuation Report for This Property
The Home Valuation Report is an in-depth analysis detailing your home's value as well as a comparison with similar homes in the area

Home Values in the Area

Source: Public Records

Average Home Value in this Area


Source: Public Records

Mortgage History

Date Status Borrower Loan Amount
Closed Nielson Roger Kent $106,317
Closed Nielson Roger Kent $101,000
Closed Nielson Roger Kent $68,000
Closed Nielson Roger Kent $50,000
Closed Nielson Roger Kent $27,000
Source: Public Records

Tax History Compared to Growth

Source: Public Records

Tax History

Year Tax Paid Tax Assessment Tax Assessment Total Assessment is a certain percentage of the fair market value that is determined by local assessors to be the total taxable value of land and additions on the property. Land Improvement
2024 $1,949 $212,843 $39,819 $173,024
2023 $1,450 $203,121 $38,341 $164,780
2022 $1,572 $177,362 $30,269 $147,093
2021 $1,466 $142,559 $22,800 $119,759
2020 $1,675 $123,097 $21,714 $101,383
2019 $1,444 $111,470 $19,540 $91,930
2018 $1,362 $93,550 $17,370 $76,180
2017 $1,256 $89,600 $18,670 $70,930
2016 $961 $89,600 $0 $0
2015 $961 $89,600 $0 $0
2014 $961 $89,600 $0 $0
Source: Public Records

Map