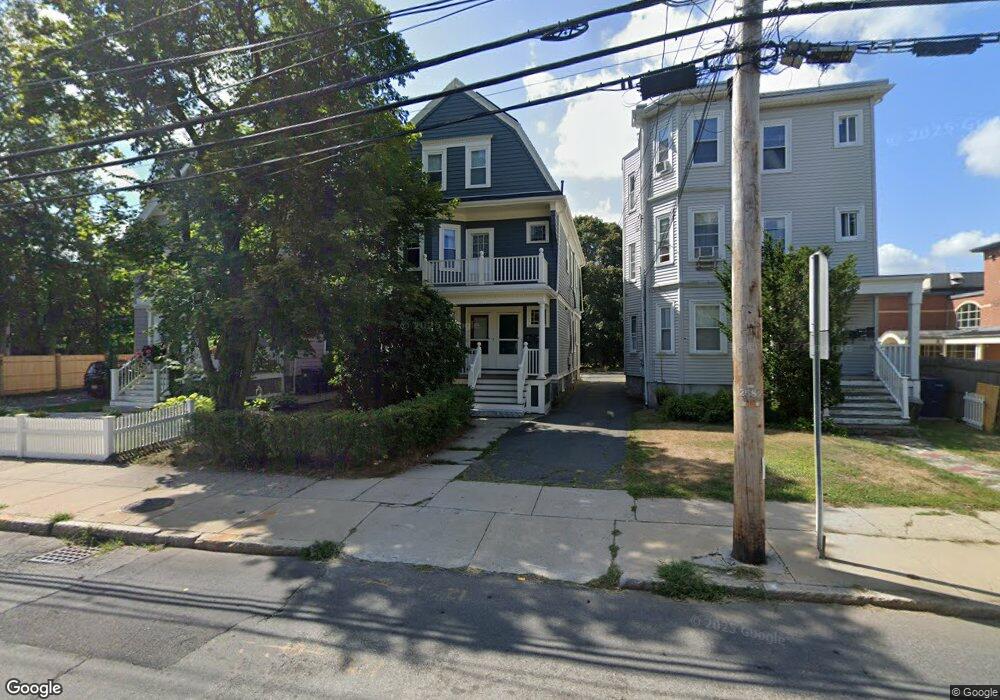
70 W Wyoming Ave Unit 70A Melrose, MA 02176
Wyoming NeighborhoodEstimated Value: $864,000 - $1,089,627
4
Beds
2
Baths
2,598
Sq Ft
$372/Sq Ft
Est. Value
About This Home
This home is located at 70 W Wyoming Ave Unit 70A, Melrose, MA 02176 and is currently estimated at $965,407, approximately $371 per square foot. 70 W Wyoming Ave Unit 70A is a home located in Middlesex County with nearby schools including Lincoln Elementary School, Winthrop Elementary School, and Horace Mann Elementary School.
Ownership History
Date
Name
Owned For
Owner Type
Purchase Details
Closed on
Aug 28, 1996
Sold by
Donnelly Matthew P and Donnelly Colleen Q
Bought by
Gyurina Steven R and Gyurina Carol H
Current Estimated Value
Home Financials for this Owner
Home Financials are based on the most recent Mortgage that was taken out on this home.
Original Mortgage
$134,800
Outstanding Balance
$11,555
Interest Rate
8.18%
Mortgage Type
Purchase Money Mortgage
Estimated Equity
$953,852
Purchase Details
Closed on
Feb 12, 1993
Sold by
Advantage Bk Svgs
Bought by
Donnelly Matthew P and Donnelly Colleen
Home Financials for this Owner
Home Financials are based on the most recent Mortgage that was taken out on this home.
Original Mortgage
$122,500
Interest Rate
8.13%
Mortgage Type
Purchase Money Mortgage
Purchase Details
Closed on
Feb 18, 1992
Sold by
Moynihan Timothy C and Moynihan Mary A
Bought by
Advantage Bk Svgs
Create a Home Valuation Report for This Property
The Home Valuation Report is an in-depth analysis detailing your home's value as well as a comparison with similar homes in the area
Home Values in the Area
Average Home Value in this Area
Purchase History
| Date | Buyer | Sale Price | Title Company |
|---|---|---|---|
| Gyurina Steven R | $168,500 | -- | |
| Donnelly Matthew P | $122,500 | -- | |
| Advantage Bk Svgs | $155,000 | -- |
Source: Public Records
Mortgage History
| Date | Status | Borrower | Loan Amount |
|---|---|---|---|
| Open | Advantage Bk Svgs | $134,800 | |
| Previous Owner | Advantage Bk Svgs | $122,500 |
Source: Public Records
Tax History Compared to Growth
Tax History
| Year | Tax Paid | Tax Assessment Tax Assessment Total Assessment is a certain percentage of the fair market value that is determined by local assessors to be the total taxable value of land and additions on the property. | Land | Improvement |
|---|---|---|---|---|
| 2025 | $84 | $844,000 | $403,300 | $440,700 |
| 2024 | $7,867 | $792,200 | $377,300 | $414,900 |
| 2023 | $7,889 | $757,100 | $351,300 | $405,800 |
| 2022 | $7,716 | $730,000 | $338,200 | $391,800 |
| 2021 | $7,541 | $688,700 | $338,200 | $350,500 |
| 2020 | $7,272 | $658,100 | $312,200 | $345,900 |
| 2019 | $5,804 | $536,900 | $286,200 | $250,700 |
| 2018 | $5,430 | $479,300 | $237,400 | $241,900 |
| 2017 | $5,334 | $452,000 | $227,700 | $224,300 |
| 2016 | $4,847 | $393,100 | $195,100 | $198,000 |
| 2015 | $4,741 | $365,800 | $185,400 | $180,400 |
| 2014 | $4,641 | $349,500 | $169,100 | $180,400 |
Source: Public Records
Map
Nearby Homes
- 447 Pleasant St
- 36 Waverly Place Unit 2
- 20 Herbert St
- 407 Pleasant St Unit 1A
- 23 Waverly Place
- 333 Main St
- 12 Mount Vernon St Unit 27
- 22 Adams St
- 16 Baxter St
- 16 Willow St Unit 207
- 9 Crescent Ave
- 58 Summer St
- 16-18 Beacon Place
- 12 Sylvan St Unit 4
- 12 Sylvan St Unit 3
- 161 Washington St
- 300 Park Terrace Dr Unit 354
- 100 Park Terrace Dr Unit 148
- 318 W Emerson St
- 220 Fellsview Terrace Unit 223
- 70 W Wyoming Ave Unit 1
- 72 W Wyoming Ave Unit 72A
- 72-7 W Wyoming Ave Unit 3
- 72 W Wyoming Ave Unit 3
- 72 W Wyoming Ave Unit 1
- 68 W Wyoming Ave
- 70-7 W Wyoming Ave
- 1 Wyoming Terrace
- 71 W Wyoming Ave Unit 1
- 71 W Wyoming Ave Unit 4
- 71 W Wyoming Ave
- 71 W Wyoming Ave Unit 7
- 71 W Wyoming Ave Unit 3
- 56 W Wyoming Ave Unit 4
- 61 W Wyoming Ave
- 81 W Wyoming Ave
- 83 W Wyoming Ave
- 53 W Wyoming Ave Unit 1
- 53 W Wyoming Ave
- 16 Hurd St