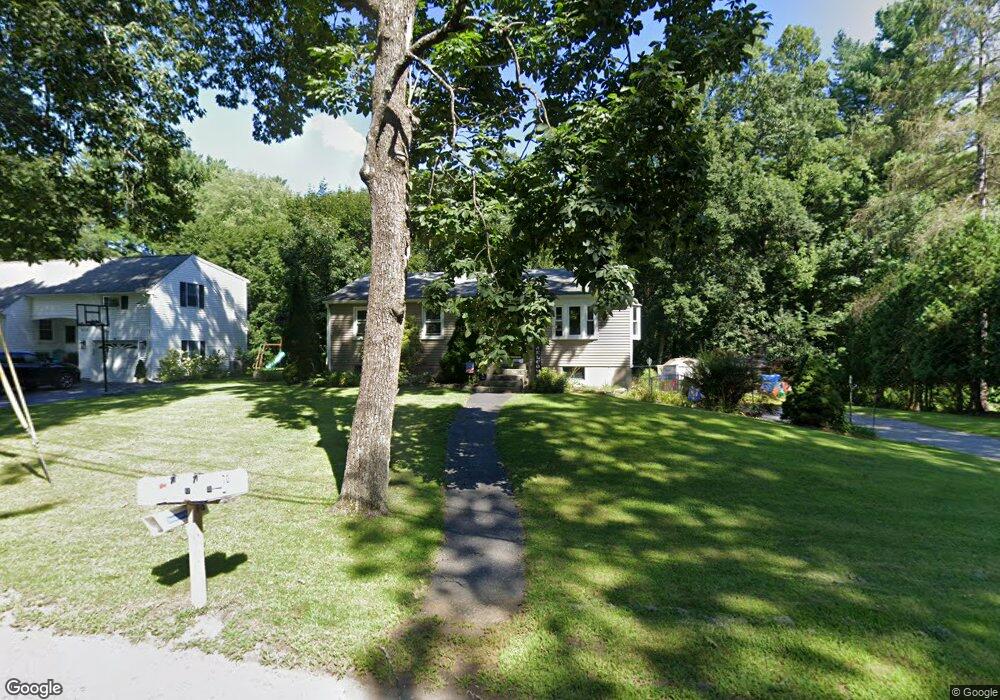
70 Washburn St Northborough, MA 01532
Estimated Value: $501,336 - $572,000
2
Beds
1
Bath
960
Sq Ft
$547/Sq Ft
Est. Value
About This Home
This home is located at 70 Washburn St, Northborough, MA 01532 and is currently estimated at $525,084, approximately $546 per square foot. 70 Washburn St is a home located in Worcester County with nearby schools including Marion E. Zeh Elementary School, Robert E. Melican Middle School, and Algonquin Regional High School.
Ownership History
Date
Name
Owned For
Owner Type
Purchase Details
Closed on
Apr 13, 2023
Sold by
Bartlett Denise M
Bought by
Bartlett Scott E and Bartlett Denise M
Current Estimated Value
Purchase Details
Closed on
Dec 14, 2017
Sold by
Kevin A Anthony Lt
Bought by
Bacon Denise M
Purchase Details
Closed on
Dec 17, 2015
Sold by
Anthony Kevin A
Bought by
Kevin A Anthony Lt and Musorofiti Heather J
Purchase Details
Closed on
Jul 30, 1993
Sold by
Miller James L and Miller Karen
Bought by
Anthony Kevin A
Home Financials for this Owner
Home Financials are based on the most recent Mortgage that was taken out on this home.
Original Mortgage
$104,100
Interest Rate
7.32%
Mortgage Type
Purchase Money Mortgage
Purchase Details
Closed on
Nov 13, 1992
Sold by
Remboski Donald and Remboski Susan
Bought by
Miller James L and Miller Karen
Home Financials for this Owner
Home Financials are based on the most recent Mortgage that was taken out on this home.
Original Mortgage
$121,050
Interest Rate
7.88%
Mortgage Type
Purchase Money Mortgage
Purchase Details
Closed on
Jan 29, 1987
Sold by
Comey Walter E
Bought by
Remboski D J
Create a Home Valuation Report for This Property
The Home Valuation Report is an in-depth analysis detailing your home's value as well as a comparison with similar homes in the area
Home Values in the Area
Average Home Value in this Area
Purchase History
| Date | Buyer | Sale Price | Title Company |
|---|---|---|---|
| Bartlett Scott E | -- | None Available | |
| Bacon Denise M | -- | -- | |
| Kevin A Anthony Lt | -- | -- | |
| Anthony Kevin A | $138,800 | -- | |
| Miller James L | $134,500 | -- | |
| Remboski D J | $135,000 | -- |
Source: Public Records
Mortgage History
| Date | Status | Borrower | Loan Amount |
|---|---|---|---|
| Previous Owner | Remboski D J | $104,100 | |
| Previous Owner | Remboski D J | $121,050 |
Source: Public Records
Tax History Compared to Growth
Tax History
| Year | Tax Paid | Tax Assessment Tax Assessment Total Assessment is a certain percentage of the fair market value that is determined by local assessors to be the total taxable value of land and additions on the property. | Land | Improvement |
|---|---|---|---|---|
| 2025 | $6,558 | $460,200 | $259,400 | $200,800 |
| 2024 | $5,736 | $401,700 | $215,100 | $186,600 |
| 2023 | $5,824 | $393,800 | $203,000 | $190,800 |
| 2022 | $5,730 | $347,500 | $193,300 | $154,200 |
| 2021 | $5,482 | $320,200 | $175,600 | $144,600 |
| 2020 | $5,525 | $320,300 | $175,600 | $144,700 |
| 2019 | $5,255 | $306,400 | $170,300 | $136,100 |
| 2018 | $4,991 | $287,000 | $166,600 | $120,400 |
| 2017 | $4,803 | $276,200 | $166,600 | $109,600 |
| 2016 | $4,648 | $270,700 | $163,200 | $107,500 |
| 2015 | $4,320 | $258,200 | $166,000 | $92,200 |
| 2014 | $4,174 | $251,600 | $166,000 | $85,600 |
Source: Public Records
Map
Nearby Homes
- 107 Washburn St
- 97 Howard St
- 23 Valentine Rd
- 460 Whitney St
- 281 Whitney St
- 86 Whitney St
- 4 Country Candle Ln Unit 4
- 14 Vanessa Dr
- 6 Silas Dr
- 6 Vanessa Dr
- 6 Macalister Dr
- 85 Hudson St Unit 85
- 85 Hudson St Unit 87
- 21 Pleasant St
- 14 Mill St
- 39 Pleasant St Unit A6
- 39 Pleasant St Unit C5
- 90 W Main St
- 5 Swan View Common Dr
- 377 Howard St