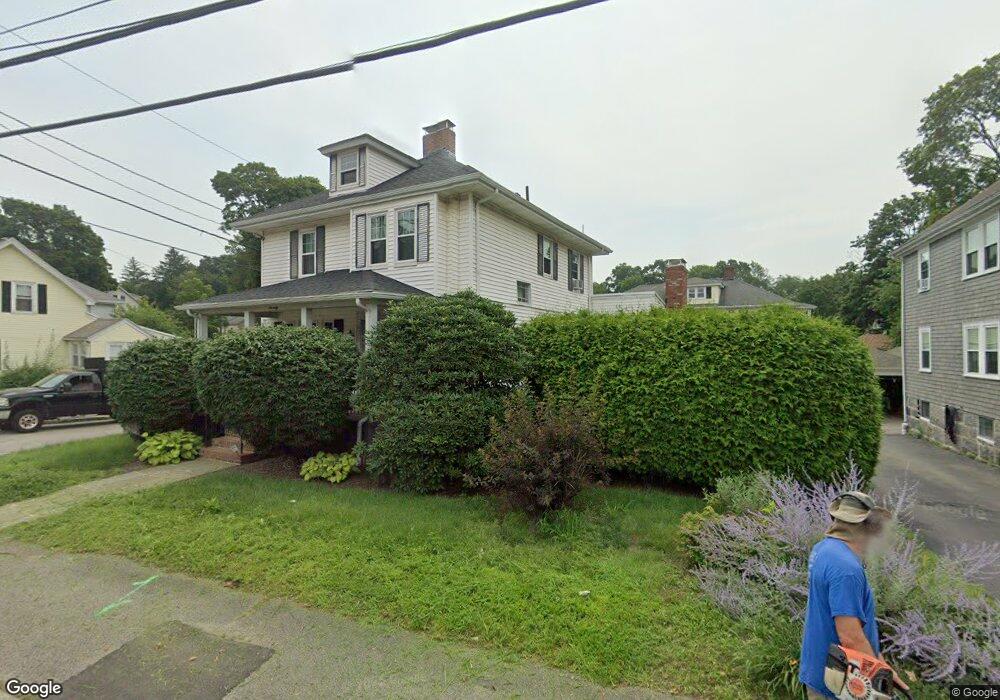
70 West St Quincy, MA 02169
South Quincy NeighborhoodEstimated Value: $727,566 - $754,000
3
Beds
2
Baths
1,714
Sq Ft
$432/Sq Ft
Est. Value
About This Home
This home is located at 70 West St, Quincy, MA 02169 and is currently estimated at $741,142, approximately $432 per square foot. 70 West St is a home located in Norfolk County with nearby schools including South West Middle School, Lincoln-Hancock Community School, and Quincy High School.
Ownership History
Date
Name
Owned For
Owner Type
Purchase Details
Closed on
Oct 12, 2011
Sold by
Galetti Paul G and Galetti Sandra J
Bought by
P&S Galetti Ft and Galetti Paul G
Current Estimated Value
Purchase Details
Closed on
Sep 11, 1998
Sold by
Salvucci Richard A and Salvucci Nancy L
Bought by
Galetti Paul G and Galetti Sandra J
Home Financials for this Owner
Home Financials are based on the most recent Mortgage that was taken out on this home.
Original Mortgage
$75,000
Interest Rate
6.92%
Mortgage Type
Purchase Money Mortgage
Create a Home Valuation Report for This Property
The Home Valuation Report is an in-depth analysis detailing your home's value as well as a comparison with similar homes in the area
Home Values in the Area
Average Home Value in this Area
Purchase History
| Date | Buyer | Sale Price | Title Company |
|---|---|---|---|
| P&S Galetti Ft | -- | -- | |
| Galetti Paul G | $199,000 | -- |
Source: Public Records
Mortgage History
| Date | Status | Borrower | Loan Amount |
|---|---|---|---|
| Previous Owner | Galetti Paul G | $75,000 |
Source: Public Records
Tax History Compared to Growth
Tax History
| Year | Tax Paid | Tax Assessment Tax Assessment Total Assessment is a certain percentage of the fair market value that is determined by local assessors to be the total taxable value of land and additions on the property. | Land | Improvement |
|---|---|---|---|---|
| 2025 | $7,232 | $627,200 | $275,500 | $351,700 |
| 2024 | $6,773 | $601,000 | $262,400 | $338,600 |
| 2023 | $6,231 | $559,800 | $238,600 | $321,200 |
| 2022 | $6,294 | $525,400 | $198,800 | $326,600 |
| 2021 | $5,915 | $487,200 | $198,800 | $288,400 |
| 2020 | $5,919 | $476,200 | $198,800 | $277,400 |
| 2019 | $5,782 | $460,700 | $187,600 | $273,100 |
| 2018 | $5,523 | $414,000 | $173,700 | $240,300 |
| 2017 | $5,511 | $388,900 | $165,400 | $223,500 |
| 2016 | $5,042 | $351,100 | $143,800 | $207,300 |
| 2015 | $4,881 | $334,300 | $143,800 | $190,500 |
| 2014 | $4,602 | $309,700 | $143,800 | $165,900 |
Source: Public Records
Map
Nearby Homes
- 42 West St
- 57 Buckley St
- 211 Copeland St
- 46-48 Buckley St
- 510 Willard St
- 211 West St Unit 12B
- 14 Arthur Ave
- 12 Arthur Ave
- 21 Arthur St
- 46 Suomi Rd
- 46 Suomi Rd Unit 46
- 91 Garfield St
- 52 Bunker Hill Ln
- 64 Garfield St Unit B
- 63 Adele Rd
- 1 Cityview Ln Unit 506
- 1 Cityview Ln Unit 210
- 1 Cityview Ln Unit 709
- 21 Totman St Unit 202
- 21 Totman St Unit 309
- 74 West St
- 74 West St Unit 74
- 74 West St Unit 76
- 74 West St Unit 2
- 76 West St Unit 76
- 76 West St Unit 2
- 9 Hynes Ave
- 62 West St
- 11 Hynes Ave Unit 2
- 11 Hynes Ave Unit 11
- 11 Hynes Ave
- 64 West St Unit 64
- 73 West St
- 15 Hynes Ave
- 84 West St Unit 1
- 84 West St
- 84 West St Unit 4
- 84 West St Unit 2
- 84 West St Unit 7
- 84 West St Unit 6