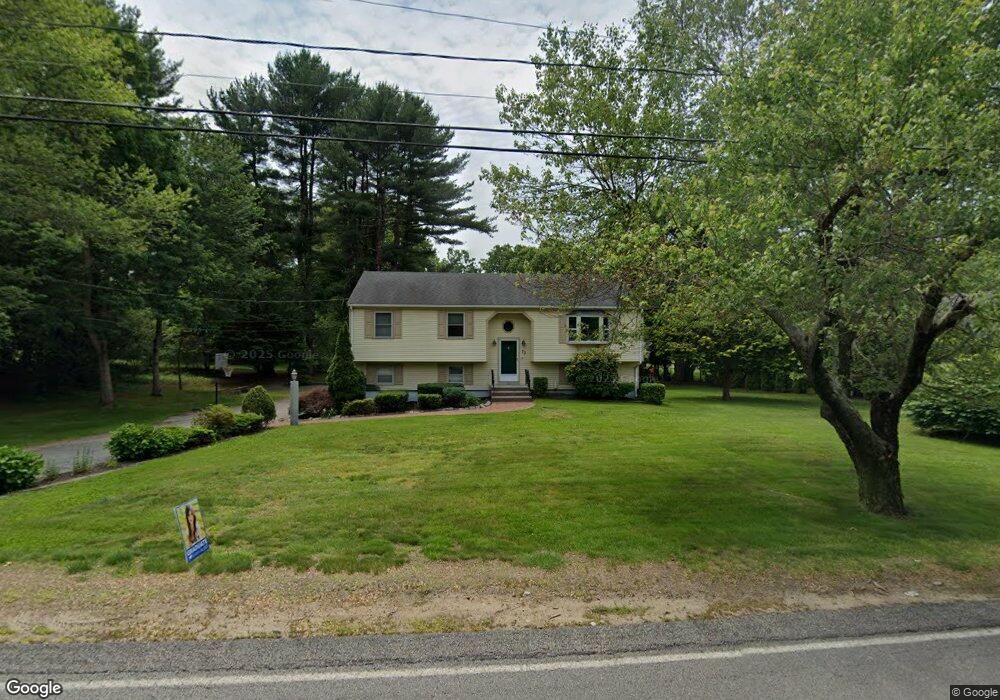
70 West St West Bridgewater, MA 02379
Estimated Value: $559,000 - $615,000
3
Beds
2
Baths
1,736
Sq Ft
$337/Sq Ft
Est. Value
About This Home
This home is located at 70 West St, West Bridgewater, MA 02379 and is currently estimated at $584,849, approximately $336 per square foot. 70 West St is a home located in Plymouth County with nearby schools including Spring Street Elementary School, Rose L. MacDonald Elementary School, and Howard Elementary School.
Ownership History
Date
Name
Owned For
Owner Type
Purchase Details
Closed on
Aug 12, 2022
Sold by
Kasper David J
Bought by
Kasper David J and Kasper Claudette
Current Estimated Value
Purchase Details
Closed on
Oct 19, 1999
Sold by
Macdonald Richard L and Macdonald Barbara A
Bought by
Tosches John A
Create a Home Valuation Report for This Property
The Home Valuation Report is an in-depth analysis detailing your home's value as well as a comparison with similar homes in the area
Home Values in the Area
Average Home Value in this Area
Purchase History
| Date | Buyer | Sale Price | Title Company |
|---|---|---|---|
| Kasper David J | -- | None Available | |
| Tosches John A | $215,000 | -- |
Source: Public Records
Mortgage History
| Date | Status | Borrower | Loan Amount |
|---|---|---|---|
| Previous Owner | Tosches John A | $140,000 | |
| Previous Owner | Tosches John A | $100,000 | |
| Previous Owner | Tosches John A | $75,000 |
Source: Public Records
Tax History Compared to Growth
Tax History
| Year | Tax Paid | Tax Assessment Tax Assessment Total Assessment is a certain percentage of the fair market value that is determined by local assessors to be the total taxable value of land and additions on the property. | Land | Improvement |
|---|---|---|---|---|
| 2025 | $6,987 | $511,100 | $224,200 | $286,900 |
| 2024 | $6,612 | $466,600 | $203,200 | $263,400 |
| 2023 | $6,231 | $405,400 | $176,000 | $229,400 |
| 2022 | $6,081 | $374,900 | $165,500 | $209,400 |
| 2021 | $5,979 | $357,800 | $165,500 | $192,300 |
| 2020 | $5,802 | $354,400 | $165,500 | $188,900 |
| 2019 | $5,604 | $339,000 | $165,500 | $173,500 |
| 2018 | $5,430 | $321,900 | $157,100 | $164,800 |
| 2017 | $5,369 | $302,800 | $142,500 | $160,300 |
| 2016 | $5,269 | $292,700 | $132,400 | $160,300 |
| 2015 | $5,179 | $290,800 | $132,400 | $158,400 |
| 2014 | $4,736 | $287,200 | $132,400 | $154,800 |
Source: Public Records
Map
Nearby Homes
- 288 Crescent St
- 282 Crescent St
- 279 Crescent St
- 260 Crescent St
- 66 Prospect St
- 122 N Elm St
- 323 S Elm St
- 227 S Elm Lot2
- 10 Charles St
- 29 Ellis Ave
- 37 Metacomet Rd Unit 37
- 58 Metacomet Rd Unit 17
- 44 Metacomet Rd Unit 44
- 281 Spring St
- 26 Indian Cove Way
- 15 Foundry St Unit A1
- 15 Foundry St Unit A3
- 15 Foundry St Unit A8
- 6 Indian Cove Way Unit 6
- 5 Indian Cove Way Unit 5