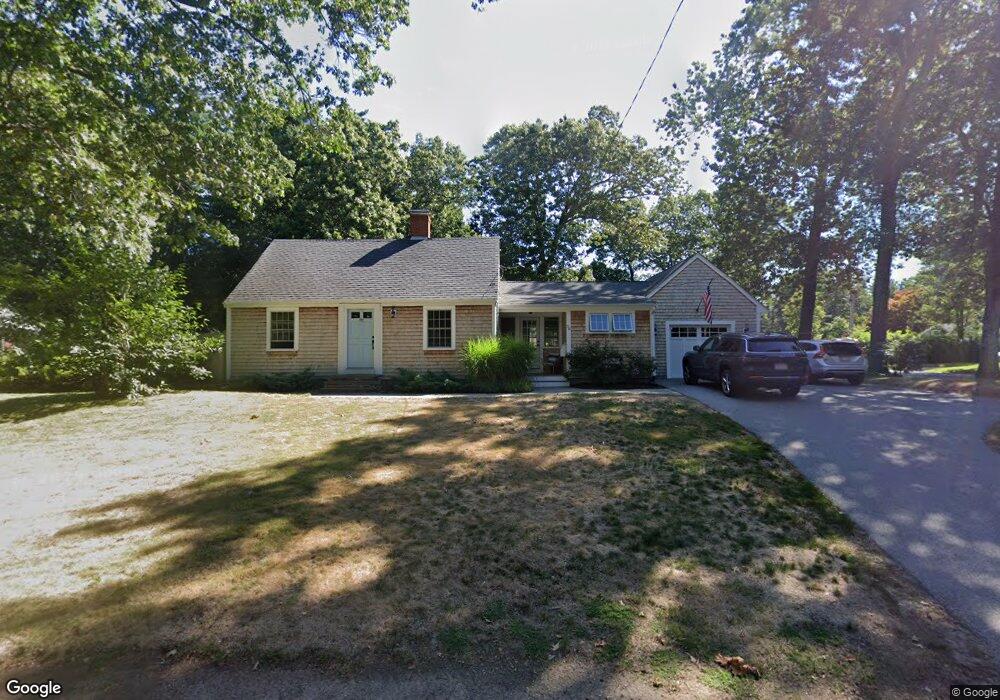
70 Whitcomb Ave Hingham, MA 02043
Estimated Value: $1,005,000 - $1,137,000
3
Beds
2
Baths
1,384
Sq Ft
$771/Sq Ft
Est. Value
About This Home
This home is located at 70 Whitcomb Ave, Hingham, MA 02043 and is currently estimated at $1,067,140, approximately $771 per square foot. 70 Whitcomb Ave is a home located in Plymouth County with nearby schools including Plymouth River Elementary School, Hingham Middle School, and Hingham High School.
Ownership History
Date
Name
Owned For
Owner Type
Purchase Details
Closed on
May 29, 2007
Sold by
Richardsson Richomnd H and Richardsson Jennifer A
Bought by
Koyce Brian G and Koyce Elizabeth
Current Estimated Value
Purchase Details
Closed on
Oct 11, 2002
Sold by
Hayward Vera T
Bought by
Richardsson Richmond H and Richardsson Jennifer A
Home Financials for this Owner
Home Financials are based on the most recent Mortgage that was taken out on this home.
Original Mortgage
$359,000
Interest Rate
6.24%
Mortgage Type
Purchase Money Mortgage
Create a Home Valuation Report for This Property
The Home Valuation Report is an in-depth analysis detailing your home's value as well as a comparison with similar homes in the area
Purchase History
| Date | Buyer | Sale Price | Title Company |
|---|---|---|---|
| Koyce Brian G | $527,500 | -- | |
| Richardsson Richmond H | $419,000 | -- |
Source: Public Records
Mortgage History
| Date | Status | Borrower | Loan Amount |
|---|---|---|---|
| Previous Owner | Richardsson Richmond H | $359,000 |
Source: Public Records
Tax History
| Year | Tax Paid | Tax Assessment Tax Assessment Total Assessment is a certain percentage of the fair market value that is determined by local assessors to be the total taxable value of land and additions on the property. | Land | Improvement |
|---|---|---|---|---|
| 2025 | $9,304 | $870,300 | $442,000 | $428,300 |
| 2024 | $8,940 | $824,000 | $442,000 | $382,000 |
| 2023 | $7,736 | $773,600 | $442,000 | $331,600 |
| 2022 | $7,114 | $615,400 | $341,200 | $274,200 |
| 2021 | $6,986 | $592,000 | $341,200 | $250,800 |
| 2020 | $6,826 | $592,000 | $341,200 | $250,800 |
| 2019 | $6,741 | $570,800 | $341,200 | $229,600 |
| 2018 | $6,668 | $566,500 | $341,200 | $225,300 |
| 2017 | $6,681 | $545,400 | $339,900 | $205,500 |
| 2016 | $6,611 | $529,300 | $323,800 | $205,500 |
| 2015 | $6,160 | $491,600 | $308,400 | $183,200 |
Source: Public Records
Map
Nearby Homes
- 2 Black Rock Dr Unit 21
- 2 Black Rock Dr
- 21 S Bradford Rd
- 5 Old County Rd
- 10 Colby Rd
- 32-70 Lazell St
- 6 Brewer Way
- 22 Linscott Rd
- 70 Lazell St
- 32 Lazell St
- 428 Main St
- 168 Stayner Dr Unit 168
- 86 Black Rock Dr
- 156 Fort Hill St
- 1 Kerri Ln
- 4 Kerri Ln
- 7 Lewis Ct
- 9 Mast Hill Rd
- 1 Gardner Terrace
- 183 Gardner St
Your Personal Tour Guide
Ask me questions while you tour the home.