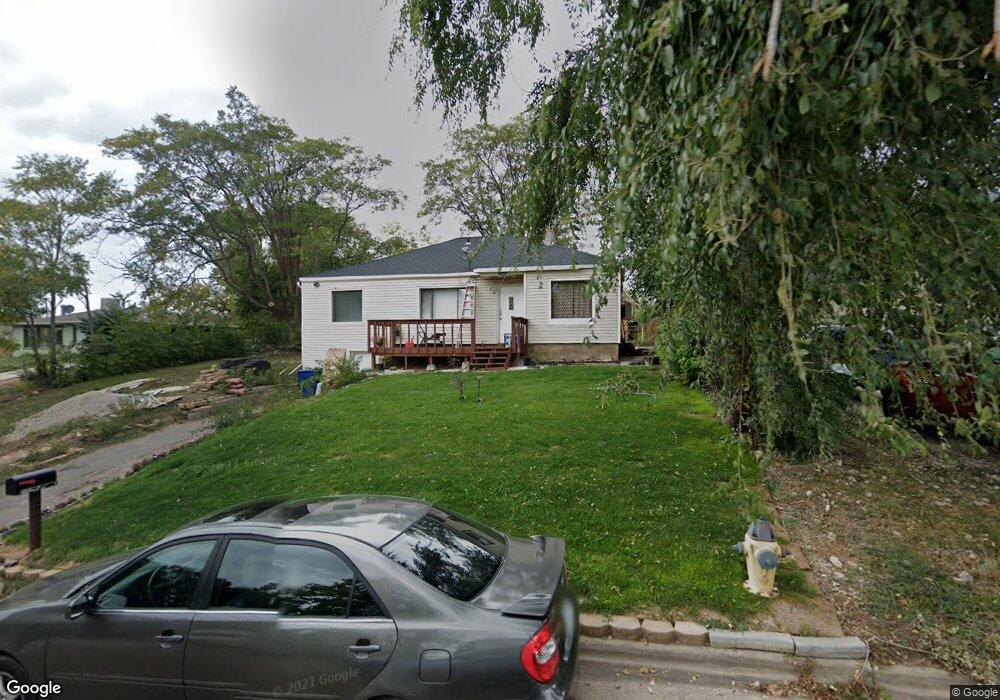
700 3rd St Unit 2 Ogden, UT 84404
Hillcrest-Bonneville NeighborhoodEstimated Value: $339,000 - $350,349
4
Beds
1
Bath
1,310
Sq Ft
$262/Sq Ft
Est. Value
About This Home
This home is located at 700 3rd St Unit 2, Ogden, UT 84404 and is currently estimated at $342,837, approximately $261 per square foot. 700 3rd St Unit 2 is a home located in Weber County with nearby schools including Bonneville School, Highland Junior High School, and Ben Lomond High School.
Ownership History
Date
Name
Owned For
Owner Type
Purchase Details
Closed on
Dec 29, 2020
Sold by
Roylance Andrew
Bought by
Gomez Juan Carlos
Current Estimated Value
Home Financials for this Owner
Home Financials are based on the most recent Mortgage that was taken out on this home.
Original Mortgage
$160,500
Outstanding Balance
$143,222
Interest Rate
2.7%
Mortgage Type
New Conventional
Estimated Equity
$199,615
Purchase Details
Closed on
Jan 10, 2018
Sold by
Flaisz Adrian R
Bought by
Roylance Andrew
Home Financials for this Owner
Home Financials are based on the most recent Mortgage that was taken out on this home.
Original Mortgage
$142,274
Interest Rate
3.75%
Mortgage Type
FHA
Purchase Details
Closed on
Sep 29, 2006
Sold by
Mckinley Carol C
Bought by
Flaisz Adrian R
Home Financials for this Owner
Home Financials are based on the most recent Mortgage that was taken out on this home.
Original Mortgage
$107,155
Interest Rate
6.53%
Mortgage Type
VA
Create a Home Valuation Report for This Property
The Home Valuation Report is an in-depth analysis detailing your home's value as well as a comparison with similar homes in the area
Home Values in the Area
Average Home Value in this Area
Purchase History
| Date | Buyer | Sale Price | Title Company |
|---|---|---|---|
| Gomez Juan Carlos | -- | Vanguard Title Insurance Age | |
| Roylance Andrew | -- | First American Title | |
| Flaisz Adrian R | -- | Equity Title South Ogden |
Source: Public Records
Mortgage History
| Date | Status | Borrower | Loan Amount |
|---|---|---|---|
| Open | Gomez Juan Carlos | $160,500 | |
| Previous Owner | Roylance Andrew | $142,274 | |
| Previous Owner | Flaisz Adrian R | $107,155 |
Source: Public Records
Tax History
| Year | Tax Paid | Tax Assessment Tax Assessment Total Assessment is a certain percentage of the fair market value that is determined by local assessors to be the total taxable value of land and additions on the property. | Land | Improvement |
|---|---|---|---|---|
| 2025 | $2,276 | $333,605 | $138,292 | $195,313 |
| 2024 | $2,271 | $179,849 | $76,060 | $103,789 |
| 2023 | $2,222 | $177,100 | $99,375 | $77,725 |
| 2022 | $2,403 | $191,950 | $52,406 | $139,544 |
| 2021 | $1,885 | $250,000 | $59,558 | $190,442 |
| 2020 | $1,682 | $206,000 | $48,758 | $157,242 |
| 2019 | $1,574 | $181,000 | $38,579 | $142,421 |
| 2018 | $1,313 | $150,000 | $33,495 | $116,505 |
| 2017 | $1,124 | $120,000 | $33,495 | $86,505 |
| 2016 | $906 | $52,291 | $17,808 | $34,483 |
| 2015 | $929 | $52,291 | $17,792 | $34,499 |
| 2014 | $884 | $48,866 | $17,792 | $31,074 |
Source: Public Records
Map
Nearby Homes
- 758 3rd St
- 756 3rd St
- 525 3rd St
- 541 Cook St
- 598 Plum Creek Ln
- 615 S Plum Creek Ln E
- 415 Jackson Ave
- 1005 Douglas St
- 1029 Douglas St
- 1042 Douglas St
- 1636 Washington Blvd
- 580 Marco Ln
- 740 N 175 E
- 983 Rancho Blvd Unit 3
- 626 Chester St
- 1108 5th St
- 426 Grant Ave
- 708 9th St
- 718 9th St
- 200 N Harrisville Rd Unit 21
Your Personal Tour Guide
Ask me questions while you tour the home.