Estimated Value: $148,000 - $192,000
3
Beds
2
Baths
1,992
Sq Ft
$84/Sq Ft
Est. Value
About This Home
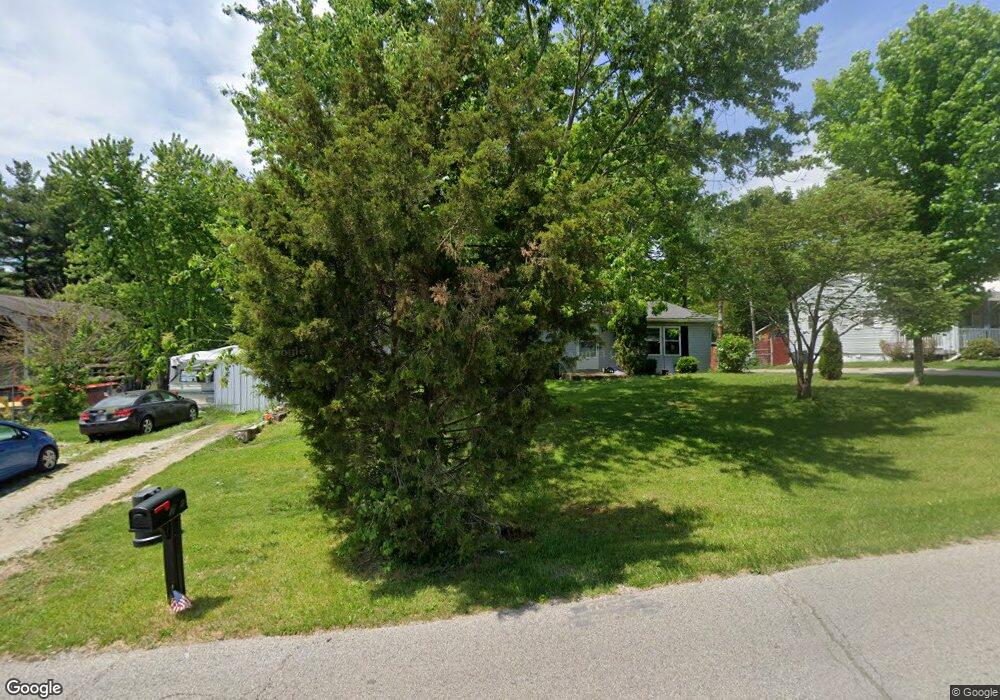
This home is located at 700 Anson St, Salem, IN 47167 and is currently estimated at $167,012, approximately $83 per square foot. 700 Anson St is a home located in Washington County with nearby schools including Bradie M. Shrum Lower Elementary School, Salem Middle School, and Salem High School.
Ownership History
Date
Name
Owned For
Owner Type
Purchase Details
Closed on
Jan 30, 2008
Sold by
Novastar Mortgage Inc
Bought by
Linden Teri R
Current Estimated Value
Home Financials for this Owner
Home Financials are based on the most recent Mortgage that was taken out on this home.
Original Mortgage
$31,200
Interest Rate
5.74%
Mortgage Type
New Conventional
Purchase Details
Closed on
Jul 24, 2007
Sold by
Evans Margie E
Bought by
Novastar Mortgage Inc
Purchase Details
Closed on
May 25, 2005
Sold by
Evans Cecil
Bought by
Evans Margie E
Home Financials for this Owner
Home Financials are based on the most recent Mortgage that was taken out on this home.
Original Mortgage
$63,000
Interest Rate
7.4%
Mortgage Type
Adjustable Rate Mortgage/ARM
Create a Home Valuation Report for This Property
The Home Valuation Report is an in-depth analysis detailing your home's value as well as a comparison with similar homes in the area
Home Values in the Area
Average Home Value in this Area
Purchase History
| Date | Buyer | Sale Price | Title Company |
|---|---|---|---|
| Linden Teri R | -- | None Available | |
| Novastar Mortgage Inc | $68,610 | None Available | |
| Evans Margie E | -- | None Available |
Source: Public Records
Mortgage History
| Date | Status | Borrower | Loan Amount |
|---|---|---|---|
| Previous Owner | Linden Teri R | $31,200 | |
| Previous Owner | Evans Margie E | $63,000 |
Source: Public Records
Tax History
| Year | Tax Paid | Tax Assessment Tax Assessment Total Assessment is a certain percentage of the fair market value that is determined by local assessors to be the total taxable value of land and additions on the property. | Land | Improvement |
|---|---|---|---|---|
| 2024 | $932 | $93,200 | $15,300 | $77,900 |
| 2023 | $862 | $85,200 | $15,300 | $69,900 |
| 2022 | $770 | $76,000 | $15,300 | $60,700 |
| 2021 | $769 | $75,900 | $15,300 | $60,600 |
| 2020 | $717 | $71,700 | $15,300 | $56,400 |
| 2019 | $690 | $69,000 | $15,300 | $53,700 |
| 2018 | $637 | $63,700 | $15,300 | $48,400 |
| 2017 | $673 | $82,000 | $15,300 | $66,700 |
| 2016 | $500 | $78,000 | $15,300 | $62,700 |
| 2014 | $429 | $76,300 | $13,000 | $63,300 |
| 2013 | $407 | $76,700 | $15,300 | $61,400 |
Source: Public Records
Map
Nearby Homes
- 115 Nichols Ave
- 905 Locust St
- 901 N College Ave
- 509 N High St
- 604 N Main St
- 409 N Water St
- 301 E Market St
- 526 Pilgrim Way
- 540 Colony Dr
- 208 Highland Dr
- 707 Iroquois Blvd
- 607 Berkey St
- 803 W Market St
- 701 S Main St
- 115 Lincoln St
- 606 Berkey St
- 114 Lincoln St
- 101, 103, & 105 Hounds Way
- 113 Maruth Dr
- 201 Marshall Ave
Your Personal Tour Guide
Ask me questions while you tour the home.