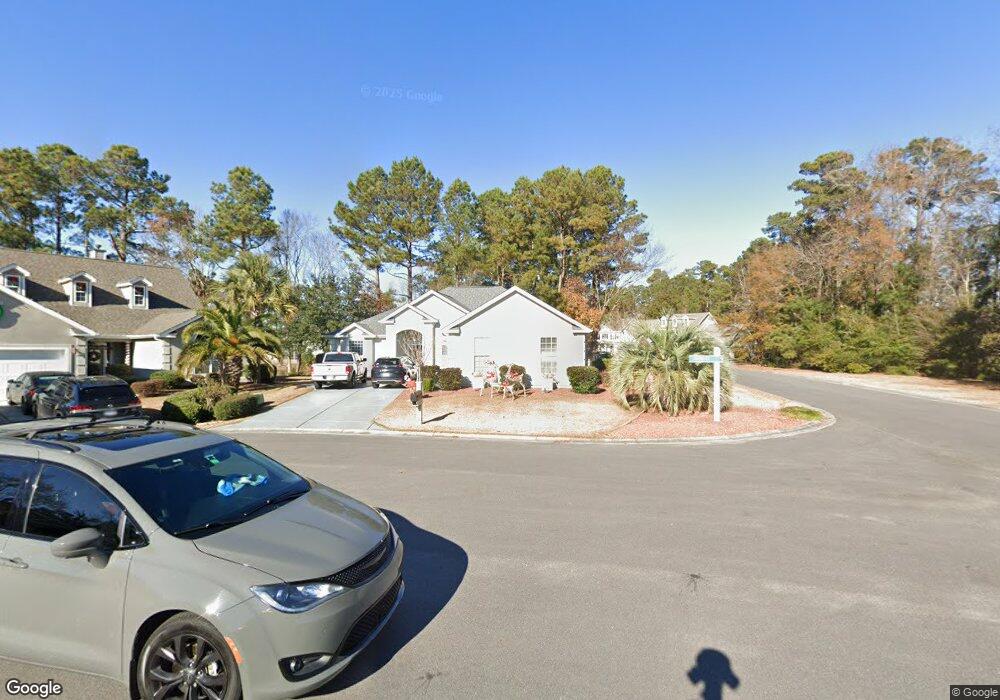
700 Caffrey Ct Unit LIMESTONE Myrtle Beach, SC 29579
Estimated Value: $416,000 - $443,000
3
Beds
2
Baths
1,858
Sq Ft
$230/Sq Ft
Est. Value
About This Home
This home is located at 700 Caffrey Ct Unit LIMESTONE, Myrtle Beach, SC 29579 and is currently estimated at $426,491, approximately $229 per square foot. 700 Caffrey Ct Unit LIMESTONE is a home located in Horry County with nearby schools including River Oaks Elementary School, Ten Oaks Middle, and Carolina Forest High School.
Ownership History
Date
Name
Owned For
Owner Type
Purchase Details
Closed on
May 23, 2023
Sold by
Lloyd Horace W
Bought by
Deffner Robert E and Deffner Linda L
Current Estimated Value
Purchase Details
Closed on
May 23, 2017
Sold by
Mccarthy
Bought by
Lloyd Horace W and Lloyd Carol A
Home Financials for this Owner
Home Financials are based on the most recent Mortgage that was taken out on this home.
Original Mortgage
$193,600
Interest Rate
4.03%
Mortgage Type
New Conventional
Purchase Details
Closed on
Apr 23, 2013
Sold by
Coyle John J
Bought by
Mccarthy Shirley
Purchase Details
Closed on
Mar 30, 2006
Sold by
D R Horton Inc
Bought by
Coyle John J and Coyle Evelyn
Home Financials for this Owner
Home Financials are based on the most recent Mortgage that was taken out on this home.
Original Mortgage
$280,537
Interest Rate
6.2%
Mortgage Type
Fannie Mae Freddie Mac
Purchase Details
Closed on
Aug 23, 2005
Sold by
Limestone Properties Llc
Bought by
D R Horton Inc
Create a Home Valuation Report for This Property
The Home Valuation Report is an in-depth analysis detailing your home's value as well as a comparison with similar homes in the area
Home Values in the Area
Average Home Value in this Area
Purchase History
| Date | Buyer | Sale Price | Title Company |
|---|---|---|---|
| Deffner Robert E | $425,000 | -- | |
| Lloyd Horace W | $245,500 | -- | |
| Mccarthy Shirley | $220,000 | -- | |
| Coyle John J | $311,708 | None Available | |
| D R Horton Inc | $108,032 | -- |
Source: Public Records
Mortgage History
| Date | Status | Borrower | Loan Amount |
|---|---|---|---|
| Previous Owner | Lloyd Horace W | $193,600 | |
| Previous Owner | Coyle John J | $280,537 |
Source: Public Records
Tax History Compared to Growth
Tax History
| Year | Tax Paid | Tax Assessment Tax Assessment Total Assessment is a certain percentage of the fair market value that is determined by local assessors to be the total taxable value of land and additions on the property. | Land | Improvement |
|---|---|---|---|---|
| 2024 | $1,639 | $16,864 | $5,750 | $11,114 |
| 2023 | $1,639 | $10,250 | $1,722 | $8,528 |
| 2021 | $870 | $10,250 | $1,722 | $8,528 |
| 2020 | $936 | $10,250 | $1,722 | $8,528 |
| 2019 | $936 | $10,250 | $1,722 | $8,528 |
| 2018 | $3,169 | $9,796 | $1,972 | $7,824 |
| 2017 | $614 | $8,526 | $1,714 | $6,812 |
| 2016 | $0 | $8,526 | $1,714 | $6,812 |
| 2015 | -- | $8,527 | $1,715 | $6,812 |
| 2014 | $2,658 | $8,527 | $1,715 | $6,812 |
Source: Public Records
Map
Nearby Homes
- 1224 Safe Haven Dr
- 673 Tidal Point Ln
- 668 Barona Dr
- 636 Barona Dr
- 801 Abalone Ct Unit MB
- 2212 Leeboard Ct
- 700 Two Rivers Ct
- 600 Barona Dr
- 514 Harbour View Dr
- 609 Needlerush Ct
- 482 Harbour View Dr
- 474 Harbour View Dr
- 450 Harbour View Dr Unit Lot 31
- 125 Lac Courte
- 424 Pomo Dr
- 265 Venice Way Unit I105
- 265 Venice Way Unit I303
- 265 Venice Way Unit 1101
- 265 Venice Way Unit 1-404
- 429 Harbour View Dr
- 700 Caffrey Ct
- 704 Caffrey Ct
- 708 Caffrey Ct Unit MB
- 177 Abcaw Blvd
- 705 Caffrey Ct Unit Arrowhead (Limestone
- 705 Caffrey Ct Unit Limestone @ Arrowhea
- 705 Caffrey Ct
- 701 Caffrey Ct Unit Limestone
- 701 Caffrey Ct Unit MB
- 165 Abcaw Blvd
- 605 Barcreek Ct
- 181 Abcaw Blvd
- 161 Abcaw Blvd
- 186 Abcaw Blvd Unit MB
- 603 Barcreek Ct
- 187 Abcaw Blvd
- 609 Barcreek Ct
- 601 Barcreek Ct
- 601 Barcreek Ct Unit Lot 55 Limestone PH
- 601 Barcreek Ct Unit Lot 55 Limestone in