Estimated Value: $52,941 - $121,000
3
Beds
--
Bath
1,090
Sq Ft
$79/Sq Ft
Est. Value
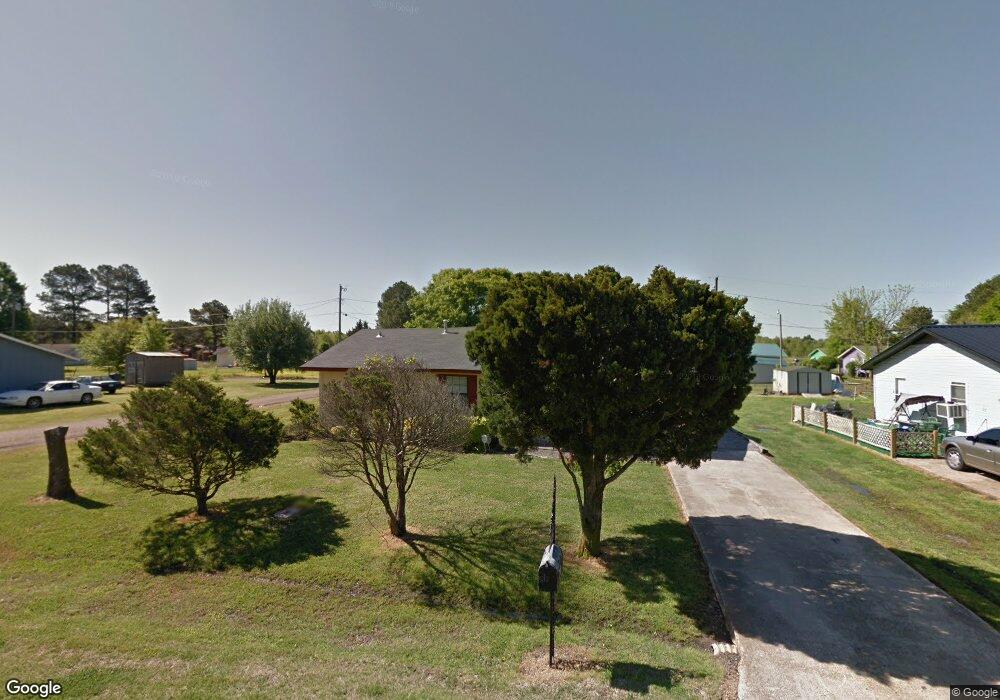
About This Home
This home is located at 700 Catchings St, Marks, MS 38646 and is currently estimated at $86,647, approximately $79 per square foot. 700 Catchings St is a home with nearby schools including Quitman County Elementary School, Quitman County Middle School, and M.S. Palmer High School.
Ownership History
Date
Name
Owned For
Owner Type
Purchase Details
Closed on
May 16, 2019
Bought by
Tillman Stanley
Current Estimated Value
Create a Home Valuation Report for This Property
The Home Valuation Report is an in-depth analysis detailing your home's value as well as a comparison with similar homes in the area
Purchase History
| Date | Buyer | Sale Price | Title Company |
|---|---|---|---|
| Tillman Stanley | -- | -- |
Source: Public Records
Tax History
| Year | Tax Paid | Tax Assessment Tax Assessment Total Assessment is a certain percentage of the fair market value that is determined by local assessors to be the total taxable value of land and additions on the property. | Land | Improvement |
|---|---|---|---|---|
| 2025 | -- | $2,758 | $500 | $2,258 |
| 2024 | -- | $2,758 | $500 | $2,258 |
| 2023 | $0 | $2,758 | $500 | $2,258 |
| 2022 | $0 | $2,758 | $500 | $2,258 |
| 2021 | $0 | $2,758 | $500 | $2,258 |
| 2020 | $834 | $4,137 | $750 | $3,387 |
| 2019 | $834 | $2,758 | $500 | $2,258 |
| 2018 | $834 | $3,972 | $750 | $3,222 |
| 2017 | $423 | $2,648 | $500 | $2,148 |
| 2016 | $423 | $2,648 | $500 | $2,148 |
| 2015 | -- | $2,648 | $500 | $2,148 |
| 2014 | -- | $2,660 | $500 | $2,160 |
| 2013 | -- | $2,660 | $500 | $2,160 |
Source: Public Records
Map
Nearby Homes
- Hwy 278
- 0 US Highway 278
- tbd Mississippi 6
- 0 Howard St
- 0 Covington Rd
- 0 Jossell Rd
- 0 Airport Rd
- Highway 6
- 502 10th St
- 10600 Highway 3
- 1211 Scott Ave
- 00 Hood Rd
- 0 278 Unit 2019001111
- 0 Eason Rd
- 1019 Jamison Rd
- 2264 Jamison Rd
- 380 Locke Station Rd
- 7245 Hood Rd
- 0 Curtis Rd Unit 4105556
- Dummyline Rd Unit LotWP001
- 702 Catchings St
- 610 Catchings St
- 701 Catchings St
- 704 Catchings St
- 703 Catchings St
- 611 Catchings St
- 608 Catchings St
- 801 Anderson St
- 705 Catchings St
- 803 Anderson St
- 706 Catchings St
- 609 Catchings St
- 805 Anderson St
- 606 Catchings St
- 707 Catchings St
- 709 Anderson St
- 607 Catchings St
- 700 Kimbro St
- 702 Kimbro St
- 800 Anderson St
Your Personal Tour Guide
Ask me questions while you tour the home.