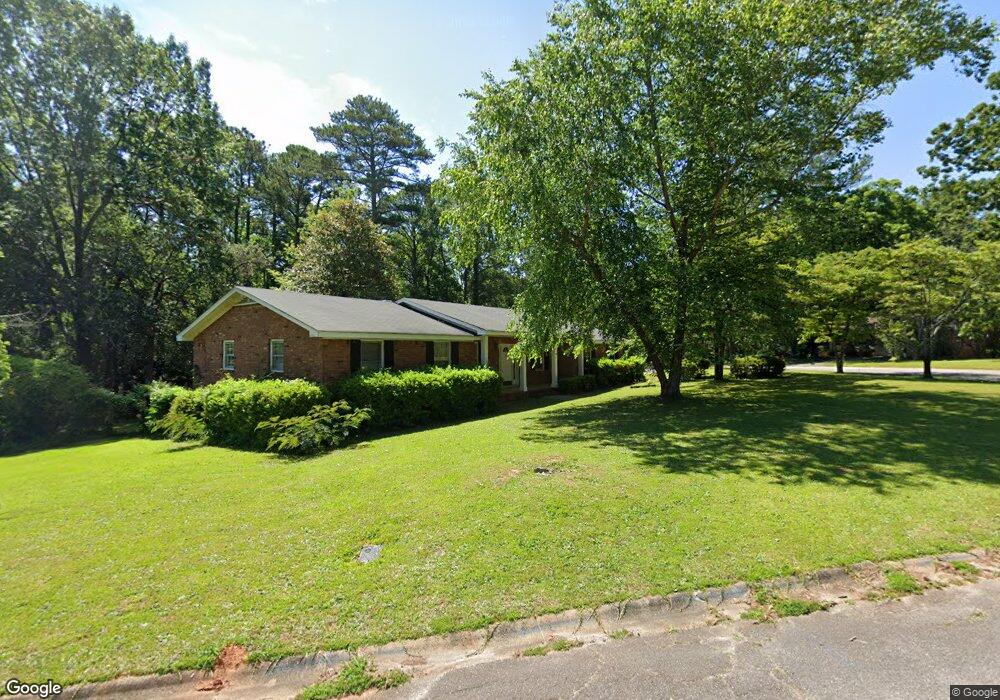
700 Challedon Dr Columbia, SC 29212
Seven Oaks NeighborhoodEstimated Value: $196,000 - $244,000
3
Beds
3
Baths
1,396
Sq Ft
$156/Sq Ft
Est. Value
About This Home
This home is located at 700 Challedon Dr, Columbia, SC 29212 and is currently estimated at $218,154, approximately $156 per square foot. 700 Challedon Dr is a home located in Lexington County with nearby schools including Leaphart Elementary School, Irmo Middle, and Irmo High.
Ownership History
Date
Name
Owned For
Owner Type
Purchase Details
Closed on
Mar 16, 2021
Sold by
Cancassi Susanna M
Bought by
Cancassi Michael S
Current Estimated Value
Home Financials for this Owner
Home Financials are based on the most recent Mortgage that was taken out on this home.
Original Mortgage
$124,999
Outstanding Balance
$112,053
Interest Rate
2.7%
Mortgage Type
New Conventional
Estimated Equity
$106,101
Purchase Details
Closed on
Feb 4, 2005
Sold by
Cumbers John Bruce and Cumbers Naomi Helen
Bought by
Cancassi Michael S and Cancassi Susanna M
Home Financials for this Owner
Home Financials are based on the most recent Mortgage that was taken out on this home.
Original Mortgage
$112,500
Interest Rate
5.66%
Mortgage Type
New Conventional
Purchase Details
Closed on
May 18, 2001
Sold by
Miller Peggy L
Bought by
Cumbers John Bruce
Purchase Details
Closed on
Oct 12, 2000
Sold by
Harris George V
Bought by
Oliger Kenneth C
Create a Home Valuation Report for This Property
The Home Valuation Report is an in-depth analysis detailing your home's value as well as a comparison with similar homes in the area
Home Values in the Area
Average Home Value in this Area
Purchase History
| Date | Buyer | Sale Price | Title Company |
|---|---|---|---|
| Cancassi Michael S | -- | None Available | |
| Cancassi Michael S | $125,000 | -- | |
| Cumbers John Bruce | $115,000 | -- | |
| Oliger Kenneth C | $175,000 | -- |
Source: Public Records
Mortgage History
| Date | Status | Borrower | Loan Amount |
|---|---|---|---|
| Open | Cancassi Michael S | $124,999 | |
| Closed | Cancassi Michael S | $112,500 |
Source: Public Records
Tax History Compared to Growth
Tax History
| Year | Tax Paid | Tax Assessment Tax Assessment Total Assessment is a certain percentage of the fair market value that is determined by local assessors to be the total taxable value of land and additions on the property. | Land | Improvement |
|---|---|---|---|---|
| 2024 | $783 | $5,112 | $1,185 | $3,927 |
| 2023 | $783 | $5,112 | $1,185 | $3,927 |
| 2022 | $799 | $5,112 | $1,185 | $3,927 |
| 2020 | $832 | $5,112 | $1,185 | $3,927 |
| 2019 | $740 | $4,445 | $720 | $3,725 |
| 2018 | $650 | $4,445 | $720 | $3,725 |
| 2017 | $632 | $4,445 | $720 | $3,725 |
| 2016 | $650 | $4,444 | $720 | $3,724 |
| 2014 | $660 | $4,485 | $877 | $3,608 |
| 2013 | -- | $4,490 | $880 | $3,610 |
Source: Public Records
Map
Nearby Homes
- 700 Lockner Rd
- 806 Lockner Rd
- 513 Pitney Rd
- 319 Valcour Rd
- 203 Broken Hill Rd
- 105 Garmony Cir
- 113 Lyndhurst Rd
- 213 Lyndhurst Rd
- 224 Stirlington Rd
- 1112 Baffin Bay Rd
- 612 Lewisham Rd
- 183 Jefferson Place
- 224 Linsbury Cir
- 217 Hunters Blind Dr
- 5227 Bush River Rd
- 340 Avery Place Dr
- 219 Ambling Cir
- 326 Townes Rd
- 5802 Mcmillan Cir
- 305 Tendrill Ct
- 318 Challedon Ct
- 706 Challedon Dr
- 619 Challedon Dr
- 606 Challedon Dr
- 625 Challedon Dr
- 312 Challedon Ct
- 325 Challedon Ct
- 613 Challedon Dr
- 712 Challedon Dr
- 319 Challedon Ct
- 653 Lockner Rd
- 701 Lockner Rd
- 306 Challedon Ct
- 607 Challedon Dr
- 600 Challedon Dr
- 549 Valmire Dr
- 313 Challedon Ct
- 543 Valmire Dr
- 647 Lockner Rd
- 348 Valcour Rd