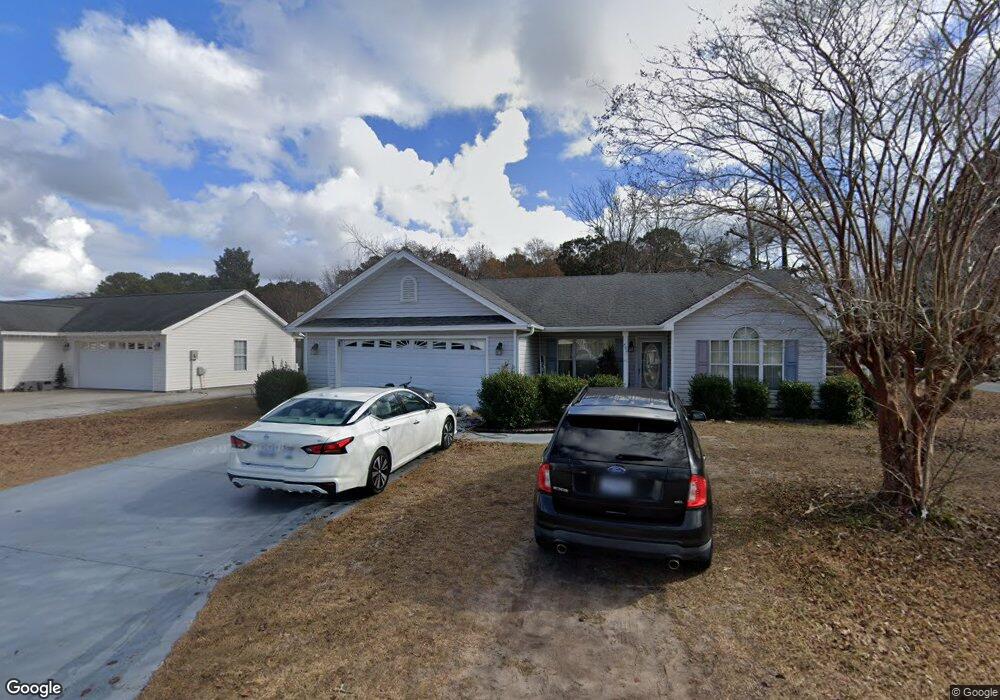
700 Drawbridge Dr Unit Castlewood Conway, SC 29526
Estimated Value: $292,000 - $319,000
3
Beds
2
Baths
1,563
Sq Ft
$195/Sq Ft
Est. Value
About This Home
This home is located at 700 Drawbridge Dr Unit Castlewood, Conway, SC 29526 and is currently estimated at $305,335, approximately $195 per square foot. 700 Drawbridge Dr Unit Castlewood is a home located in Horry County with nearby schools including Palmetto Bays Elementary School, Black Water Middle School, and Carolina Forest High School.
Ownership History
Date
Name
Owned For
Owner Type
Purchase Details
Closed on
Apr 29, 2016
Sold by
Ashford John C
Bought by
Vincent Francis M
Current Estimated Value
Home Financials for this Owner
Home Financials are based on the most recent Mortgage that was taken out on this home.
Original Mortgage
$157,312
Outstanding Balance
$125,435
Interest Rate
3.71%
Estimated Equity
$179,900
Purchase Details
Closed on
Feb 9, 2000
Sold by
Frontier Home Developers Inc
Bought by
Ashford John C and Ashford Shirley A
Purchase Details
Closed on
Oct 21, 1999
Sold by
Castlewood Development Co Inc
Bought by
Frontier Home Developers Inc
Home Financials for this Owner
Home Financials are based on the most recent Mortgage that was taken out on this home.
Original Mortgage
$19,710
Interest Rate
7.76%
Mortgage Type
Purchase Money Mortgage
Create a Home Valuation Report for This Property
The Home Valuation Report is an in-depth analysis detailing your home's value as well as a comparison with similar homes in the area
Home Values in the Area
Average Home Value in this Area
Purchase History
| Date | Buyer | Sale Price | Title Company |
|---|---|---|---|
| Vincent Francis M | $154,000 | -- | |
| Vincent Francis M | $154,000 | -- | |
| Ashford John C | $124,300 | -- | |
| Frontier Home Developers Inc | $21,900 | -- |
Source: Public Records
Mortgage History
| Date | Status | Borrower | Loan Amount |
|---|---|---|---|
| Open | Vincent Francis M | $157,312 | |
| Closed | Vincent Francis M | $157,312 | |
| Previous Owner | Frontier Home Developers Inc | $19,710 |
Source: Public Records
Tax History Compared to Growth
Tax History
| Year | Tax Paid | Tax Assessment Tax Assessment Total Assessment is a certain percentage of the fair market value that is determined by local assessors to be the total taxable value of land and additions on the property. | Land | Improvement |
|---|---|---|---|---|
| 2024 | $2,471 | $18,432 | $5,100 | $13,332 |
| 2023 | $2,471 | $10,300 | $1,499 | $8,801 |
| 2021 | $2,280 | $10,568 | $1,676 | $8,892 |
| 2020 | $2,157 | $10,568 | $1,676 | $8,892 |
| 2019 | $2,157 | $10,568 | $1,676 | $8,892 |
| 2018 | $0 | $8,956 | $1,288 | $7,668 |
| 2017 | $1,935 | $8,956 | $1,288 | $7,668 |
| 2016 | $0 | $8,188 | $1,288 | $6,900 |
| 2015 | -- | $5,459 | $859 | $4,600 |
| 2014 | $315 | $5,459 | $859 | $4,600 |
Source: Public Records
Map
Nearby Homes
- 800 Riverbirch Dr
- 1874 Rolling Hills Dr
- 1127 Lancelot Ln
- 5010 Medieval Dr
- 773 Drawbridge Dr
- 1293 Gailard Dr
- 4336 Parkland Dr Unit Legends Resort Parkl
- 938 Fox Hollow Rd
- 3591 Ashridge Way
- 3599 Ashridge Way Unit Lot 1045- Cali S
- 4357 Parkland Dr
- Fairview Plan at Meadows Edge - Single Family Homes
- Woodford Plan at Meadows Edge - Single Family Homes
- Torrey Plan at Meadows Edge - Single Family Homes
- Sequoia Plan at Meadows Edge - Single Family Homes
- 4363 Parkland Dr
- Poplar Plan at Meadows Edge - Townhomes
- 2047 Palm Meadows Way Unit Lot 103
- 4000 Girvan Dr
- 1023 Oak Meadow Dr Unit Lot 170
- 700 Drawbridge Dr
- 702 Drawbridge Dr
- 602 Jousting Ct
- 602 Jousting Ct Unit Lot 276
- 701 Drawbridge Dr
- 819 Myrtle Ridge Dr
- 703 Drawbridge Dr
- 705 Drawbridge Dr
- 821 Myrtle Ridge Dr
- 207 Palace Ct
- 707 Drawbridge Dr
- 998 Chateau Dr
- 823 Myrtle Ridge Dr
- 825 Myrtle Ridge Dr
- 708 Drawbridge Dr
- 205 Palace Ct
- 1000 Chateau Dr
- 825 Castlewood Dr
- 603 Jousting Ct
- 996 Chateau Dr