
Seller's Agent in 2026
LEEROY RIVAS
Rivas Real Estate Team Co.
(575) 318-6228
397 Total Sales
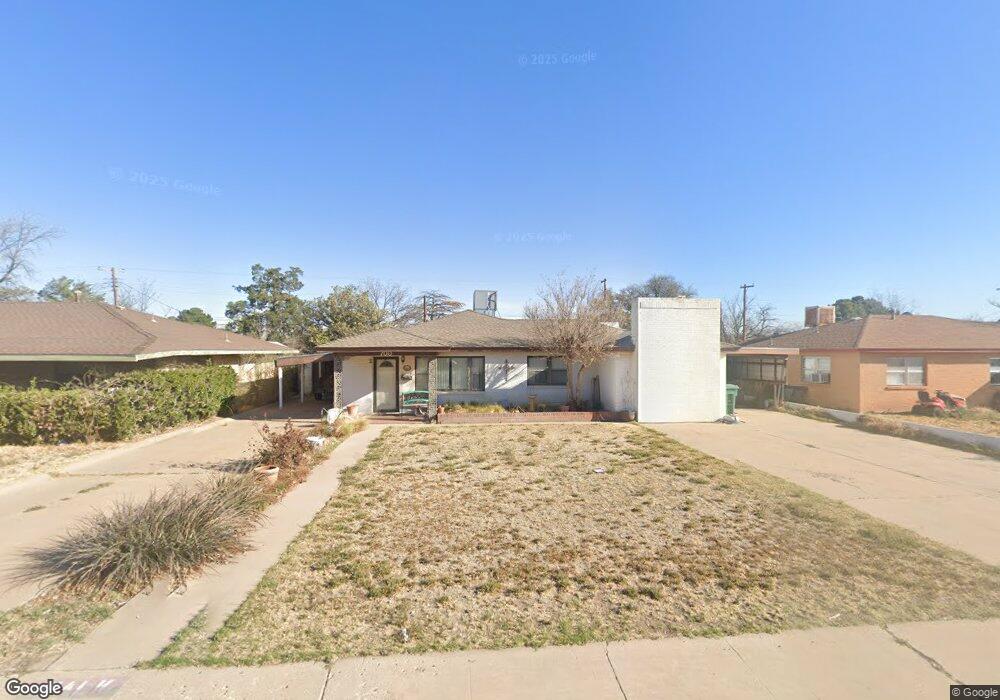
Estimated Value: $209,000 - $240,000
Schedule Your Tour for this Spacious Home Located in an Established Neighborhood in Hobbs, NM. This home features 3 bedrooms and 2 baths with cozy fireplace. Home also has an in-ground pool in the back of the property. This is a unique property located in close proximity to schools, shopping, and restaurants. Schedule Your Showing Today!
We collect this data history from publicly available records. To have your information removed, we recommend requesting removal directly through your county’s website.
| Date | Event | Price | List to Sale | Price per Sq Ft |
|---|---|---|---|---|
| 06/13/2026 06/13/26 | Pending | -- | -- | -- |
| 06/13/2026 06/13/26 | Off Market | -- | -- | -- |
| 06/11/2026 06/11/26 | For Sale | $225,000 | 0.0% | $127 / Sq Ft |
| 05/30/2026 05/30/26 | Pending | -- | -- | -- |
| 04/27/2026 04/27/26 | For Sale | $225,000 | 0.0% | $127 / Sq Ft |
| 02/27/2026 02/27/26 | Pending | -- | -- | -- |
| 02/20/2026 02/20/26 | Price Changed | $225,000 | -8.2% | $127 / Sq Ft |
| 02/03/2026 02/03/26 | For Sale | $245,000 | 0.0% | $138 / Sq Ft |
| 01/19/2026 01/19/26 | Pending | -- | -- | -- |
| 01/16/2026 01/16/26 | For Sale | $245,000 | -- | $138 / Sq Ft |
We collect this data history from publicly available records. To have your information removed, we recommend requesting removal directly through your county’s website.
| Year | Tax Paid | Tax Assessment Tax Assessment Total Assessment is a certain percentage of the fair market value that is determined by local assessors to be the total taxable value of land and additions on the property. | Land | Improvement |
|---|---|---|---|---|
| 2025 | $967 | $37,842 | $2,223 | $35,619 |
| 2024 | $980 | $37,842 | $2,223 | $35,619 |
| 2023 | $993 | $37,842 | $2,223 | $35,619 |
| 2022 | $980 | $37,842 | $2,223 | $35,619 |
| 2021 | $978 | $37,842 | $2,223 | $35,619 |
| 2020 | $963 | $37,842 | $2,223 | $35,619 |
| 2019 | $947 | $37,842 | $2,223 | $35,619 |
| 2018 | $936 | $37,842 | $2,223 | $35,619 |
| 2017 | $960 | $110,220 | $6,474 | $103,746 |
| 2016 | $968 | $107,010 | $6,285 | $100,725 |
| 2015 | $124 | $103,893 | $6,102 | $97,791 |
| 2014 | $114 | $100,869 | $5,925 | $94,944 |
Seller's Agent in 2026
LEEROY RIVAS
Rivas Real Estate Team Co.
(575) 318-6228
397 Total Sales
M
Buyer's Agent in 2026
Masiel Corrales
Rivas Real Estate Team Co.
(575) 392-7355
4 Total Sales
Ask me questions while you tour the home.