Estimated Value: $335,000 - $418,091
--
Bed
--
Bath
3,390
Sq Ft
$114/Sq Ft
Est. Value
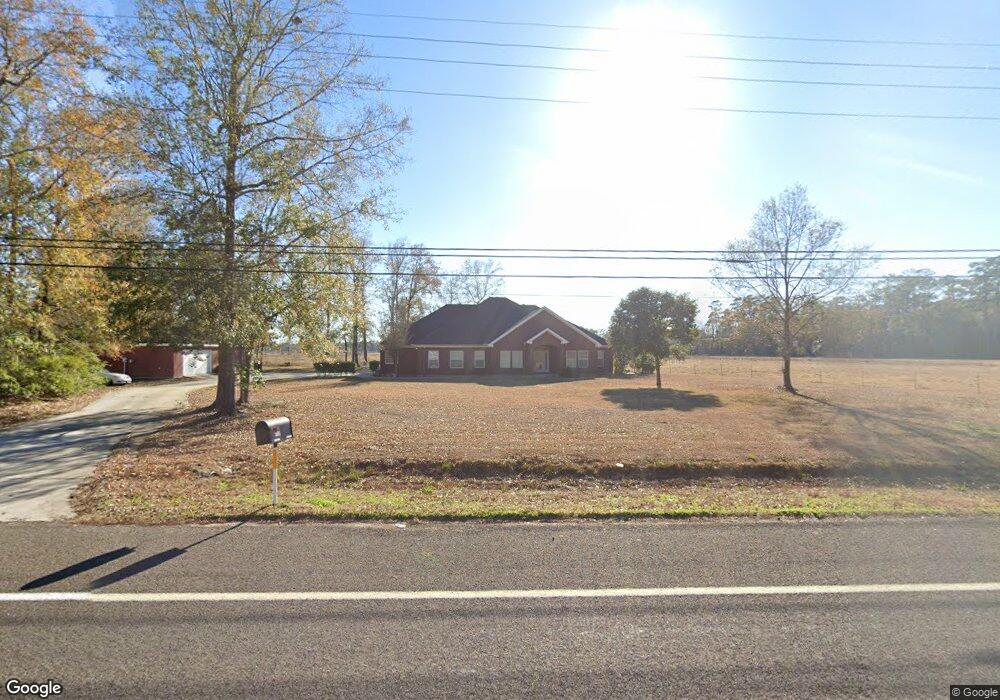
About This Home
This home is located at 700 Evangeline Dr, Vidor, TX 77662 and is currently estimated at $384,773, approximately $113 per square foot. 700 Evangeline Dr is a home located in Orange County with nearby schools including Faith Christian Academy.
Ownership History
Date
Name
Owned For
Owner Type
Purchase Details
Closed on
Aug 13, 2018
Sold by
Decuir Aaron M and Decuir Kristian N
Bought by
Hunteman Christina and Hunteman Jerry
Current Estimated Value
Home Financials for this Owner
Home Financials are based on the most recent Mortgage that was taken out on this home.
Original Mortgage
$273,000
Outstanding Balance
$236,595
Interest Rate
4.5%
Mortgage Type
New Conventional
Estimated Equity
$148,178
Purchase Details
Closed on
Dec 27, 2016
Sold by
Daniel Laura Sue
Bought by
Decuir Aaron M and Decuir Kristian N
Home Financials for this Owner
Home Financials are based on the most recent Mortgage that was taken out on this home.
Original Mortgage
$260,073
Interest Rate
3.75%
Mortgage Type
FHA
Purchase Details
Closed on
May 5, 2005
Sold by
Parkwood Land Company Inc
Bought by
Decuir Aaron M
Create a Home Valuation Report for This Property
The Home Valuation Report is an in-depth analysis detailing your home's value as well as a comparison with similar homes in the area
Home Values in the Area
Average Home Value in this Area
Purchase History
| Date | Buyer | Sale Price | Title Company |
|---|---|---|---|
| Hunteman Christina | -- | Capital Title | |
| Decuir Aaron M | -- | None Available | |
| Decuir Aaron M | -- | -- |
Source: Public Records
Mortgage History
| Date | Status | Borrower | Loan Amount |
|---|---|---|---|
| Open | Hunteman Christina | $273,000 | |
| Previous Owner | Decuir Aaron M | $260,073 |
Source: Public Records
Tax History Compared to Growth
Tax History
| Year | Tax Paid | Tax Assessment Tax Assessment Total Assessment is a certain percentage of the fair market value that is determined by local assessors to be the total taxable value of land and additions on the property. | Land | Improvement |
|---|---|---|---|---|
| 2025 | $8,969 | $411,054 | $16,052 | $395,002 |
| 2024 | $6,723 | $418,085 | $16,052 | $402,033 |
| 2023 | $8,392 | $398,634 | $16,052 | $382,582 |
| 2022 | $6,607 | $344,321 | $10,701 | $333,620 |
| 2021 | $8,301 | $323,797 | $10,701 | $317,920 |
| 2020 | $7,713 | $294,361 | $10,701 | $283,660 |
| 2019 | $7,613 | $286,551 | $10,701 | $275,850 |
| 2018 | $7,561 | $287,081 | $10,701 | $276,380 |
| 2017 | $4,774 | $226,251 | $10,701 | $215,550 |
| 2016 | $5,540 | $210,281 | $10,701 | $199,580 |
| 2015 | $4,251 | $199,124 | $10,701 | $188,423 |
| 2014 | $4,251 | $197,597 | $10,701 | $186,896 |
Source: Public Records
Map
Nearby Homes
- 555 Hwy 1132
- 0000 Orange St
- 000 Berwick St
- 0 Caney Creek Rd
- 2195 Berwick St
- 0 Laurel Street Lot 10
- 1140 Mitzi St
- 2135 N Main St
- 1990 N Main St
- 2790 N Main St
- 000 Yupon St
- 1270 Operators Ln
- 735 Warwick Dr
- 1280 N Main St
- 940 Dundee Dr
- 1865 Wexford Dr
- 1600 Dublin Dr
- 2619 Waterford Way
- 800 W Tram Rd
- tbd W Tram Rd Unit lot 2
- 700 Evangeline Dr
- 740 Evangeline Dr
- 740 Evangeline Dr
- 2645 Baywood St
- 2650 Baywood St
- 2675 Baywood St
- 675 Evangeline Dr
- 750 Evangeline Dr
- 635 Evangeline Dr
- 855 Evangeline Dr
- 2670 Baywood St
- 755 Evangeline Dr
- 610 Highway 1132
- 2785 Baywood St
- 820 Evangeline Dr
- 2770 Baywood St
- 620 Evangeline Dr
- 615 Evangeline Dr
- 832 Evangeline Dr
- 2780 Baywood St