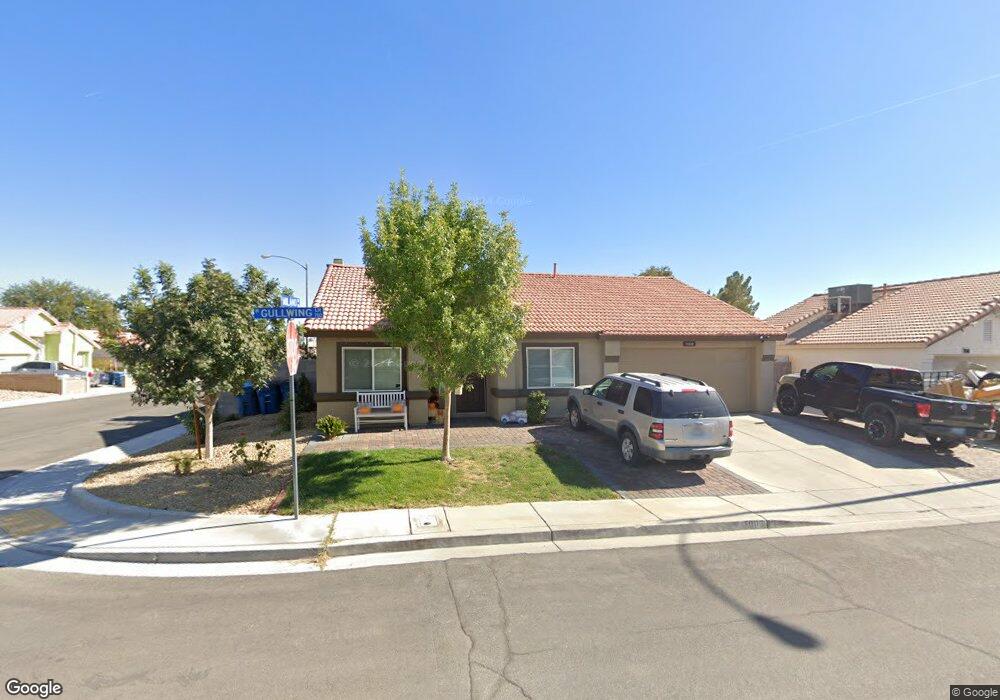
700 Gullwing Ln North Las Vegas, NV 89081
Northridge NeighborhoodEstimated Value: $323,000 - $368,183
3
Beds
2
Baths
1,359
Sq Ft
$258/Sq Ft
Est. Value
About This Home
This home is located at 700 Gullwing Ln, North Las Vegas, NV 89081 and is currently estimated at $351,296, approximately $258 per square foot. 700 Gullwing Ln is a home located in Clark County with nearby schools including Raul P. Elizondo Elementary School, Clifford O. Findlay Middle School, and Mojave High School.
Ownership History
Date
Name
Owned For
Owner Type
Purchase Details
Closed on
Nov 26, 2019
Sold by
Gonzalez Martha Leticia Angulo
Bought by
Castaneda Alvarez Francisco
Current Estimated Value
Home Financials for this Owner
Home Financials are based on the most recent Mortgage that was taken out on this home.
Original Mortgage
$193,561
Outstanding Balance
$173,225
Interest Rate
4.4%
Mortgage Type
FHA
Estimated Equity
$178,071
Purchase Details
Closed on
Aug 28, 2009
Sold by
Hsbc Bank Usa Na
Bought by
Castaneda Alvarez Francisco
Home Financials for this Owner
Home Financials are based on the most recent Mortgage that was taken out on this home.
Original Mortgage
$92,297
Interest Rate
4.92%
Mortgage Type
FHA
Purchase Details
Closed on
Apr 17, 2009
Sold by
Mcneil James R and Mcneil Lisa A
Bought by
Hsbc Bank Usa Na
Purchase Details
Closed on
Oct 7, 2008
Sold by
Mcneil James R and Mcneil Lisa A
Bought by
Hsbc Bank Usa Na
Create a Home Valuation Report for This Property
The Home Valuation Report is an in-depth analysis detailing your home's value as well as a comparison with similar homes in the area
Home Values in the Area
Average Home Value in this Area
Purchase History
| Date | Buyer | Sale Price | Title Company |
|---|---|---|---|
| Castaneda Alvarez Francisco | -- | Stewart Title Company | |
| Castaneda Alvarez Francisco | $94,000 | Equity Title Of Nevada | |
| Hsbc Bank Usa Na | $104,000 | Commercial Title | |
| Hsbc Bank Usa Na | $104,000 | Commonwealth Title |
Source: Public Records
Mortgage History
| Date | Status | Borrower | Loan Amount |
|---|---|---|---|
| Open | Castaneda Alvarez Francisco | $193,561 | |
| Previous Owner | Castaneda Alvarez Francisco | $92,297 |
Source: Public Records
Tax History Compared to Growth
Tax History
| Year | Tax Paid | Tax Assessment Tax Assessment Total Assessment is a certain percentage of the fair market value that is determined by local assessors to be the total taxable value of land and additions on the property. | Land | Improvement |
|---|---|---|---|---|
| 2025 | $1,347 | $75,230 | $29,750 | $45,480 |
| 2024 | $1,248 | $75,230 | $29,750 | $45,480 |
| 2023 | $1,248 | $71,913 | $28,350 | $43,563 |
| 2022 | $1,156 | $63,453 | $23,450 | $40,003 |
| 2021 | $1,070 | $58,189 | $19,950 | $38,239 |
| 2020 | $991 | $58,048 | $19,950 | $38,098 |
| 2019 | $929 | $52,099 | $14,350 | $37,749 |
| 2018 | $886 | $47,642 | $12,600 | $35,042 |
| 2017 | $1,581 | $47,129 | $12,600 | $34,529 |
| 2016 | $831 | $41,258 | $9,800 | $31,458 |
| 2015 | $828 | $34,829 | $7,000 | $27,829 |
| 2014 | $802 | $23,198 | $5,250 | $17,948 |
Source: Public Records
Map
Nearby Homes
- 729 Gullwing Ln
- 4526 Shannon Jean Ct
- 4534 Roper Ct
- 4543 Shannon Jean Ct
- 1016 Stoneypeak Ave
- 4640 Cliff Breeze Dr
- 748 Stagecoach Ave
- 555 E Lone Mountain Rd
- 4728 Cloudy Morning St
- 1310 Ripplestone Ave
- 1106 Granite Ash Ave
- 4848 Cutting Diamond Ct
- 4717 Cedar Ranch Ct
- 124 Zenith Point Ave
- 4909 Finca St
- 33 Newburg Ave
- 4746 Roby Grey Way
- 1014 Edgestone Mark Ave
- 4929 Siglo St
- 4935 Stormy Ridge St