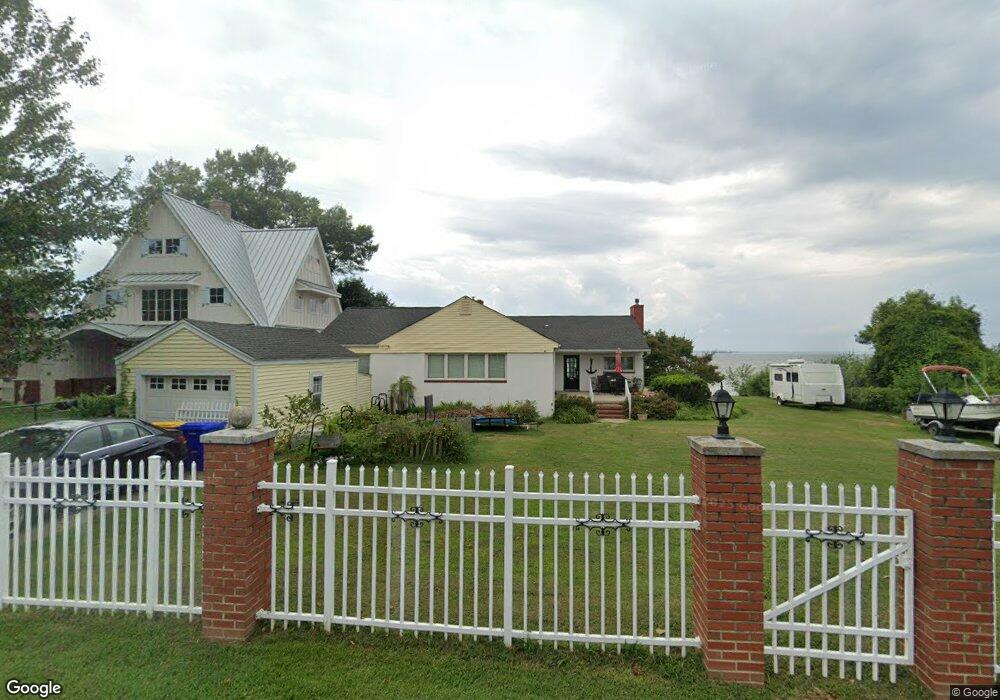
700 Kentmorr Rd Stevensville, MD 21666
Estimated Value: $716,000 - $911,000
--
Bed
2
Baths
2,444
Sq Ft
$336/Sq Ft
Est. Value
About This Home
This home is located at 700 Kentmorr Rd, Stevensville, MD 21666 and is currently estimated at $820,692, approximately $335 per square foot. 700 Kentmorr Rd is a home located in Queen Anne's County with nearby schools including Matapeake Elementary School, Matapeake Middle School, and Kent Island High School.
Ownership History
Date
Name
Owned For
Owner Type
Purchase Details
Closed on
Aug 2, 2024
Sold by
Shore Home Llc
Bought by
Grogan Peter Andrew and Rickards Catherine Anielia
Current Estimated Value
Purchase Details
Closed on
Feb 22, 2016
Sold by
Us Bank National Association
Bought by
Shore Home Llc
Purchase Details
Closed on
Sep 25, 2015
Sold by
Grogan Peter A
Bought by
U S Bank National Association
Purchase Details
Closed on
Feb 15, 2007
Sold by
Grogan Peter A
Bought by
Chaires Sherrell H and Grogan Peter A
Purchase Details
Closed on
Nov 20, 2006
Sold by
Grogan Peter A
Bought by
Chaires Sherrell H and Grogan Peter A
Purchase Details
Closed on
May 20, 2004
Sold by
Creutzer Frederick G
Bought by
Grogan Peter A and Chaires Sherrell H
Purchase Details
Closed on
Mar 29, 2004
Sold by
Damiani Roseanne
Bought by
Creutzer Frederick G and Shifflett Sr C Bruce E
Create a Home Valuation Report for This Property
The Home Valuation Report is an in-depth analysis detailing your home's value as well as a comparison with similar homes in the area
Home Values in the Area
Average Home Value in this Area
Purchase History
| Date | Buyer | Sale Price | Title Company |
|---|---|---|---|
| Grogan Peter Andrew | -- | None Listed On Document | |
| Grogan Peter Andrew | -- | None Listed On Document | |
| Shore Home Llc | $425,000 | Chicago Title Insurance | |
| U S Bank National Association | $502,000 | None Available | |
| Chaires Sherrell H | -- | -- | |
| Chaires Sherrell H | -- | -- | |
| Grogan Peter A | $500,000 | -- | |
| Creutzer Frederick G | -- | -- |
Source: Public Records
Mortgage History
| Date | Status | Borrower | Loan Amount |
|---|---|---|---|
| Closed | Chaires Sherrell H | -- |
Source: Public Records
Tax History Compared to Growth
Tax History
| Year | Tax Paid | Tax Assessment Tax Assessment Total Assessment is a certain percentage of the fair market value that is determined by local assessors to be the total taxable value of land and additions on the property. | Land | Improvement |
|---|---|---|---|---|
| 2025 | $6,416 | $727,333 | $0 | $0 |
| 2024 | $6,077 | $645,067 | $0 | $0 |
| 2023 | $5,362 | $562,800 | $455,500 | $107,300 |
| 2022 | $5,360 | $562,633 | $0 | $0 |
| 2021 | $5,453 | $562,467 | $0 | $0 |
| 2020 | $5,453 | $562,300 | $459,800 | $102,500 |
| 2019 | $5,384 | $555,100 | $0 | $0 |
| 2018 | $5,315 | $547,900 | $0 | $0 |
| 2017 | $5,246 | $540,700 | $0 | $0 |
| 2016 | -- | $586,267 | $0 | $0 |
| 2015 | $2,282 | $581,433 | $0 | $0 |
| 2014 | $2,282 | $576,600 | $0 | $0 |
Source: Public Records
Map
Nearby Homes
- 0 Reynolds Ave
- 0 Allen Ave
- 511 Chesapeake Ave
- 312 Queens Colony High Rd
- 303 Queens Colony High Rd
- 114 Queens Colony High Rd
- 206 Columbia Ln
- 227 Queen Anne Club Dr
- 410 5 Farms Dr
- 303 Queen Anne Club Dr
- 312 Columbia Ln
- 412 Five Farms Dr
- Lot 7 Maple Rd
- 0 Chesapeake Estates Dr
- 103 Chesapeake Estates Dr
- 116 Mallard Dr
- 122 Mallard Dr
- 1709 Batts Neck Rd
- 321 Oregon Rd
- 101 Oak St
- 704 Kentmorr Rd
- 708 Kentmorr Rd
- 701 Kentmorr Rd
- 808 Kentmorr Rd
- 800 Kentmorr Rd
- 514 Kentmorr Rd
- 517 Kentmorr Rd
- 0 Ave Unit MDQA2008914
- 804 Kentmorr Rd
- 600 Kentmorr Rd
- 512 Kentmorr Rd
- 509 Kentmorr Rd
- 806 Kentmorr Rd
- 803 Kentmorr Rd
- 810 Kentmorr Rd
- 507 Reynolds Ave
- 512 Reynolds Ave
- 900 Kentmorr Rd
- 506 Kentmorr Rd
- 512 Lane Ave