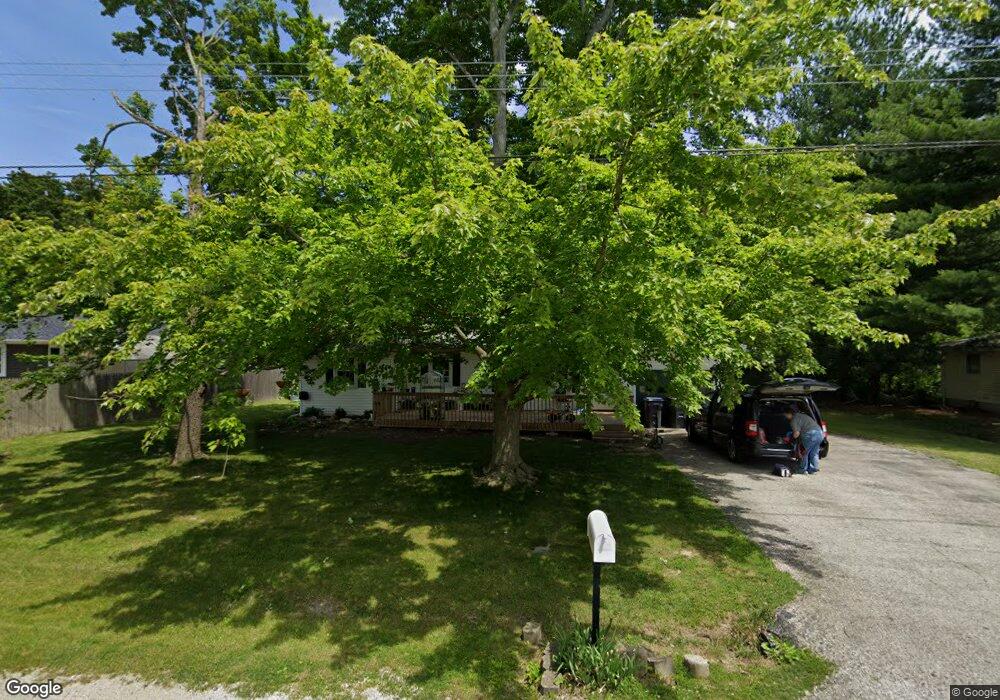
700 Lawrence Dr Mount Zion, IL 62549
Estimated Value: $123,000 - $145,000
3
Beds
1
Bath
956
Sq Ft
$143/Sq Ft
Est. Value
About This Home
This home is located at 700 Lawrence Dr, Mount Zion, IL 62549 and is currently estimated at $137,158, approximately $143 per square foot. 700 Lawrence Dr is a home located in Macon County with nearby schools including McGaughey Elementary School, Mt. Zion Intermediate School, and Mt. Zion Elementary School.
Ownership History
Date
Name
Owned For
Owner Type
Purchase Details
Closed on
Feb 8, 2022
Sold by
Hawtwig Paul
Bought by
Kautz Properties Llc
Current Estimated Value
Home Financials for this Owner
Home Financials are based on the most recent Mortgage that was taken out on this home.
Original Mortgage
$94,400
Interest Rate
2.77%
Mortgage Type
New Conventional
Purchase Details
Closed on
Sep 30, 2019
Sold by
Renton Rebecca E and Foth Brad Thomas
Bought by
Hartwig Paul
Home Financials for this Owner
Home Financials are based on the most recent Mortgage that was taken out on this home.
Original Mortgage
$85,914
Interest Rate
4.63%
Mortgage Type
FHA
Purchase Details
Closed on
Jun 27, 2005
Sold by
Miller David G and Miller Kelly I
Bought by
Picrson Rebecca E
Home Financials for this Owner
Home Financials are based on the most recent Mortgage that was taken out on this home.
Original Mortgage
$12,150
Interest Rate
5.43%
Mortgage Type
Stand Alone Second
Purchase Details
Closed on
Sep 1, 2002
Create a Home Valuation Report for This Property
The Home Valuation Report is an in-depth analysis detailing your home's value as well as a comparison with similar homes in the area
Home Values in the Area
Average Home Value in this Area
Purchase History
| Date | Buyer | Sale Price | Title Company |
|---|---|---|---|
| Kautz Properties Llc | -- | -- | |
| Hartwig Paul | $87,500 | None Available | |
| Picrson Rebecca E | $81,000 | None Available | |
| -- | $76,000 | -- |
Source: Public Records
Mortgage History
| Date | Status | Borrower | Loan Amount |
|---|---|---|---|
| Previous Owner | Kautz Properties Llc | $94,400 | |
| Previous Owner | Hartwig Paul | $85,914 | |
| Previous Owner | Picrson Rebecca E | $12,150 |
Source: Public Records
Tax History
| Year | Tax Paid | Tax Assessment Tax Assessment Total Assessment is a certain percentage of the fair market value that is determined by local assessors to be the total taxable value of land and additions on the property. | Land | Improvement |
|---|---|---|---|---|
| 2024 | $3,058 | $39,178 | $7,261 | $31,917 |
| 2023 | $2,405 | $36,438 | $6,753 | $29,685 |
| 2022 | $2,286 | $33,622 | $6,405 | $27,217 |
| 2021 | $2,200 | $31,498 | $6,000 | $25,498 |
| 2020 | $2,117 | $30,833 | $6,791 | $24,042 |
| 2019 | $2,117 | $30,833 | $6,791 | $24,042 |
| 2018 | $2,045 | $30,046 | $6,618 | $23,428 |
| 2017 | $2,012 | $29,469 | $6,491 | $22,978 |
| 2016 | $1,987 | $28,956 | $6,378 | $22,578 |
| 2015 | $1,918 | $28,669 | $6,315 | $22,354 |
| 2014 | $1,849 | $28,669 | $6,315 | $22,354 |
| 2013 | $1,871 | $28,669 | $6,315 | $22,354 |
Source: Public Records
Map
Nearby Homes
- 645 Pearl Ct
- 415 Mintler Dr
- 210 Bell Ct
- Lot 20 Jeffrey Ln
- 512 Woodland Ct
- 524 Elm St
- 6686 John Dr
- Lot 32 Janine Way
- Lot 3 Fletcher Ln
- Lot 1 Fletcher Ln
- 355 S Henderson St
- 3930 S Mount Zion Rd
- Lot 27 Tara Pkwy
- Lot 31 Woodbine Park Prairie Estates
- 10A Kimm Ln
- 10B Kimm Ln
- 3740 S Mount Zion Rd
- 265 Carrington Ave
- 860 W Wildwood Dr
- 1065 Country Manor
- 630 Lawrence Dr
- 715 E Walnut St
- 705 Lawrence Dr
- 620 Lawrence Dr
- 715 Lawrence Dr
- 710 E Walnut St
- 700 E Walnut St
- 630 Park Dr
- 635 E Walnut St
- 605 Lawrence Dr
- 600 Lawrence Dr
- 640 E Walnut St
- 630 E Walnut St
- 635 Park Dr
- 590 Lawrence Dr
- 620 Park Dr
- 625 E Walnut St
- 640 Wagoner Dr
- 620 E Walnut St
- 630 Wagoner Dr
Your Personal Tour Guide
Ask me questions while you tour the home.