Estimated Value: $164,841
Studio
--
Bath
1,553
Sq Ft
$106/Sq Ft
Est. Value
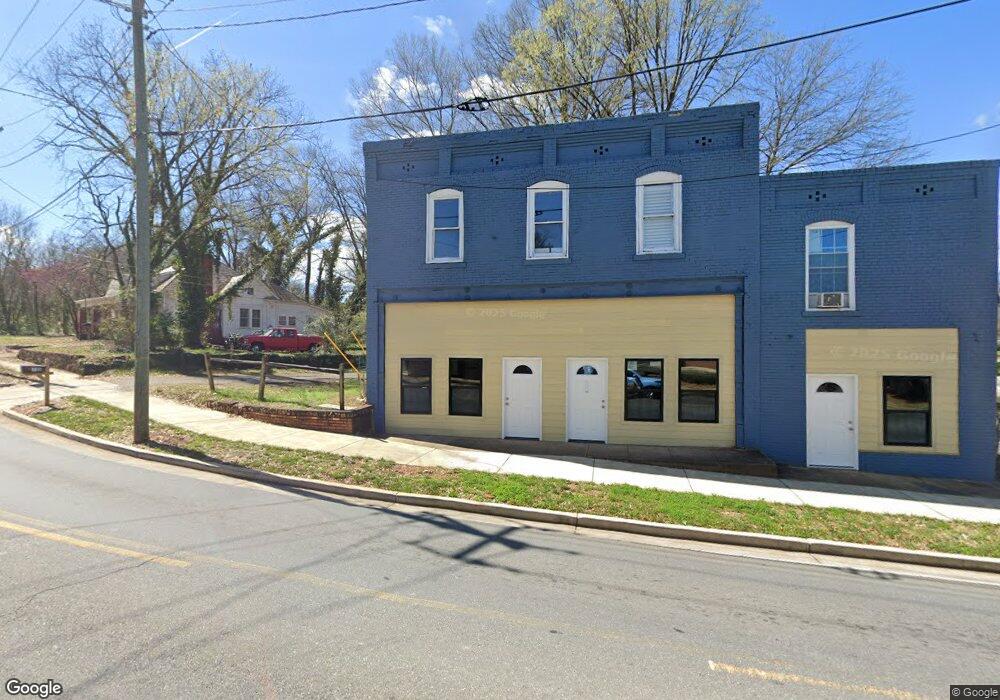
About This Home
This home is located at 700 Maple Ave SE, Rome, GA 30161 and is currently estimated at $164,841, approximately $106 per square foot. 700 Maple Ave SE is a home located in Floyd County with nearby schools including Rome High School, St. Mary School, and Darlington School.
Ownership History
Date
Name
Owned For
Owner Type
Purchase Details
Closed on
Mar 17, 2020
Sold by
Chai Yuan
Bought by
Properties By A & C Llc
Current Estimated Value
Purchase Details
Closed on
Apr 15, 2019
Sold by
Masters Nation Christopher
Bought by
Chai Yuan
Purchase Details
Closed on
Feb 18, 2014
Sold by
Nation Danny Morris
Bought by
Nation Christopher Masters
Purchase Details
Closed on
Dec 30, 2013
Sold by
Nation Christopher Masters
Bought by
Nation Danny Morris
Purchase Details
Closed on
Jul 25, 2011
Sold by
Masters Bonnie Carole
Bought by
Nation Christopher Masters
Purchase Details
Closed on
Aug 4, 2008
Sold by
Masters Robert A
Bought by
Masters Bonnie Carole
Purchase Details
Closed on
Dec 3, 1985
Sold by
Youngblood Earlton B
Bought by
Masters Robert A
Purchase Details
Closed on
Dec 20, 1984
Bought by
P and R
Purchase Details
Closed on
Aug 16, 1984
Bought by
Youngblood Earlton B
Create a Home Valuation Report for This Property
The Home Valuation Report is an in-depth analysis detailing your home's value as well as a comparison with similar homes in the area
Home Values in the Area
Average Home Value in this Area
Purchase History
| Date | Buyer | Sale Price | Title Company |
|---|---|---|---|
| Properties By A & C Llc | $48,000 | -- | |
| Chai Yuan | $35,000 | -- | |
| Nation Christopher Masters | -- | -- | |
| Nation Danny Morris | -- | -- | |
| Nation Christopher Masters | -- | -- | |
| Nation Christopher Masters | -- | -- | |
| Masters Bonnie Carole | -- | -- | |
| Masters Robert A | $26,000 | -- | |
| P | -- | -- | |
| Youngblood Earlton B | $20,000 | -- |
Source: Public Records
Tax History
| Year | Tax Paid | Tax Assessment Tax Assessment Total Assessment is a certain percentage of the fair market value that is determined by local assessors to be the total taxable value of land and additions on the property. | Land | Improvement |
|---|---|---|---|---|
| 2025 | $1,910 | $53,436 | $6,622 | $46,814 |
| 2024 | $1,910 | $53,436 | $6,622 | $46,814 |
| 2023 | $1,087 | $30,943 | $6,020 | $24,923 |
| 2022 | $1,129 | $30,943 | $6,020 | $24,923 |
| 2021 | $976 | $30,943 | $6,020 | $24,923 |
| 2020 | $524 | $16,556 | $5,418 | $11,138 |
| 2019 | $575 | $15,541 | $5,418 | $10,123 |
| 2018 | $544 | $14,688 | $5,418 | $9,270 |
| 2017 | $544 | $14,688 | $5,418 | $9,270 |
| 2016 | $545 | $14,688 | $5,400 | $9,288 |
| 2015 | $515 | $14,688 | $5,400 | $9,288 |
| 2014 | $515 | $14,688 | $5,400 | $9,288 |
Source: Public Records
Map
Nearby Homes
- 801 Maple Ave SW
- 2 Coral Ave SW
- 9 Eastridge Ct SW
- 209 Moultrie Ln SE
- 803/805 Maple Ave SW
- 803/80 Maple Ave SW
- 1 E 11th St SW
- 166 E 11th St SW
- 162 E 11th St SE
- 168 E 11th St SE
- 164 E 11th St SE
- 170 E 11th St SW
- 31 Notasulga Dr SW
- 1011 Walnut Ave SW
- 416 E 9th St SE
- 419 E 13th St SW
- 415 E 10th St SE
- 320 E 3rd Ave
- 307 E 11th St SE
- 311 Roswell Ave SE
- 802 Maple Ave SW
- 804 Maple Ave SW
- 609 Maple Ave SW
- 803 Maple Ave SW
- 6 E 6th Ave Unit 4124
- 5 E 8th St SW
- 805 Maple Ave SW
- 219 E 6th St SW
- 808 Maple Ave SW
- 4 E 8th St SW
- 599 Walnut Ave SW
- 807 Maple Ave SW
- 7 E 8th St SW
- 810 Maple Ave SW
- 217 E 6th St SW
- 6 E 8th St SW
- E E 6th St
- 306 E 6th St SW
- 310 E 6th St
- 308 E 6th St SW
Your Personal Tour Guide
Ask me questions while you tour the home.