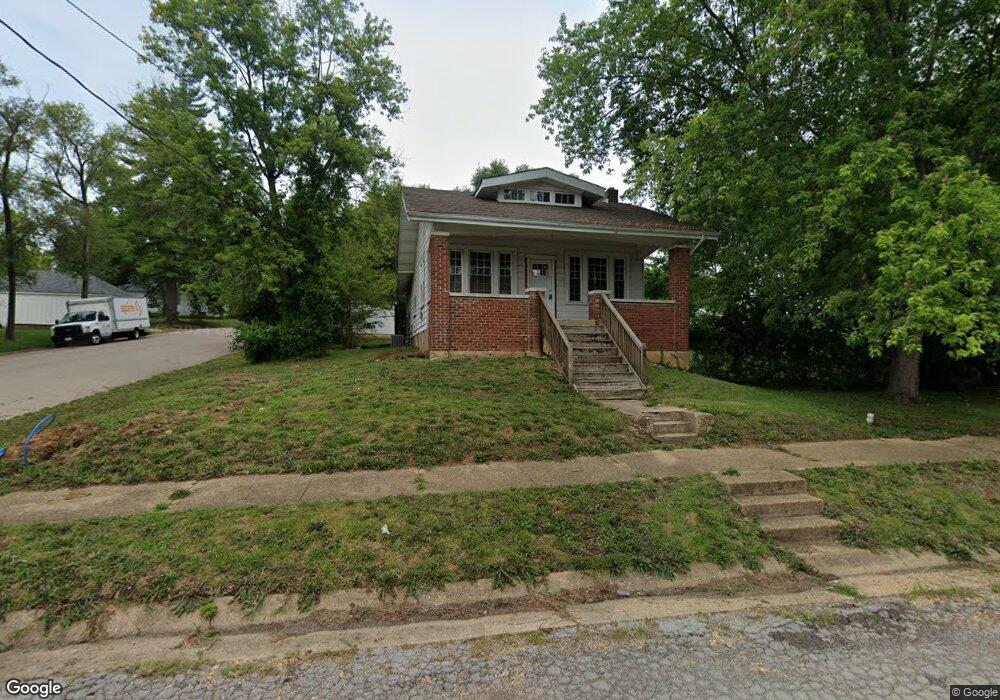
700 N 5th St de Soto, MO 63020
Estimated Value: $163,000 - $217,000
2
Beds
1
Bath
1,177
Sq Ft
$154/Sq Ft
Est. Value
About This Home
This home is located at 700 N 5th St, de Soto, MO 63020 and is currently estimated at $181,066, approximately $153 per square foot. 700 N 5th St is a home located in Jefferson County with nearby schools including De Soto Senior High School and St Rose Of Lima School.
Ownership History
Date
Name
Owned For
Owner Type
Purchase Details
Closed on
Oct 27, 2023
Sold by
Ctb Properties Llc
Bought by
Sideways 8S Llc
Current Estimated Value
Purchase Details
Closed on
Oct 19, 2023
Sold by
Sideways 8S Llc
Bought by
Sideways 8S Llc
Purchase Details
Closed on
Oct 2, 2023
Sold by
Mvd Properties Llc
Bought by
Ctb Properties Llc
Purchase Details
Closed on
Aug 20, 2008
Sold by
Dickerson Mike and Dickerson Vicky
Bought by
Mvd Properties Llc
Purchase Details
Closed on
Jul 7, 2008
Sold by
Gmac Mortgage Llc
Bought by
Dickerson Mike
Purchase Details
Closed on
May 28, 2008
Sold by
Missey Joseph R and Missey Jennifer A
Bought by
Gmac Mortgage Llc
Purchase Details
Closed on
Jul 29, 1997
Sold by
Skiles Richard D and Skiles Amber L
Bought by
Missey Joseph R and Missey Jennifer A
Home Financials for this Owner
Home Financials are based on the most recent Mortgage that was taken out on this home.
Original Mortgage
$43,165
Interest Rate
6.5%
Create a Home Valuation Report for This Property
The Home Valuation Report is an in-depth analysis detailing your home's value as well as a comparison with similar homes in the area
Home Values in the Area
Average Home Value in this Area
Purchase History
| Date | Buyer | Sale Price | Title Company |
|---|---|---|---|
| Sideways 8S Llc | -- | None Listed On Document | |
| Sideways 8S Llc | -- | None Listed On Document | |
| Ctb Properties Llc | -- | None Listed On Document | |
| Mvd Properties Llc | -- | Htc | |
| Dickerson Mike | -- | Continental Title | |
| Gmac Mortgage Llc | $84,150 | None Available | |
| Missey Joseph R | -- | -- |
Source: Public Records
Mortgage History
| Date | Status | Borrower | Loan Amount |
|---|---|---|---|
| Previous Owner | Missey Joseph R | $43,165 |
Source: Public Records
Tax History
| Year | Tax Paid | Tax Assessment Tax Assessment Total Assessment is a certain percentage of the fair market value that is determined by local assessors to be the total taxable value of land and additions on the property. | Land | Improvement |
|---|---|---|---|---|
| 2025 | $853 | $16,300 | $1,100 | $15,200 |
| 2024 | $853 | $13,300 | $1,100 | $12,200 |
| 2023 | $853 | $13,300 | $1,100 | $12,200 |
| 2022 | $851 | $13,300 | $1,100 | $12,200 |
| 2021 | $850 | $13,300 | $1,100 | $12,200 |
| 2020 | $795 | $12,200 | $900 | $11,300 |
| 2019 | $794 | $12,200 | $900 | $11,300 |
| 2018 | $774 | $12,200 | $900 | $11,300 |
| 2017 | $772 | $12,200 | $900 | $11,300 |
| 2016 | $715 | $11,100 | $1,000 | $10,100 |
| 2015 | $710 | $11,100 | $1,000 | $10,100 |
| 2013 | -- | $10,500 | $1,000 | $9,500 |
Source: Public Records
Map
Nearby Homes
- 713 Lansdowne St
- 700 Lovett St
- 904 N 2nd St
- 422 N 2nd St
- 308 N 7th St
- 705 Stewart St
- 507 McKissock St
- 110 Clarke St
- 4 Easton St
- 518 N 12th St
- Lot 1B of Hawks Retreat
- 1207 Coachlite Dr
- 3 Easton St
- 1612 N 6th St
- Lot #2 Clarke St
- Lot #5 Clarke St
- Lot #4 Clarke St
- Lot #1 Clarke St
- Lot #6 Clarke St
- Lot #3 Clarke St
Your Personal Tour Guide
Ask me questions while you tour the home.