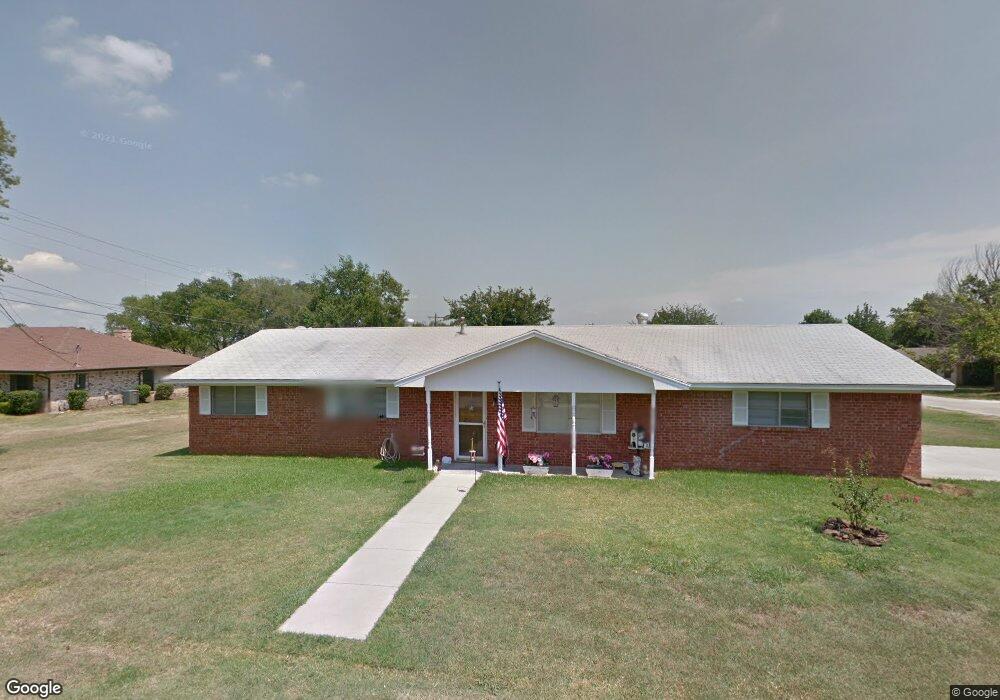
700 S 3rd St Sanger, TX 76266
Estimated Value: $244,000 - $354,000
3
Beds
2
Baths
1,344
Sq Ft
$207/Sq Ft
Est. Value
About This Home
This home is located at 700 S 3rd St, Sanger, TX 76266 and is currently estimated at $278,683, approximately $207 per square foot. 700 S 3rd St is a home located in Denton County with nearby schools including Butterfield Elementary School, Clear Creek Intermediate School, and Sanger Sixth Grade Campus.
Ownership History
Date
Name
Owned For
Owner Type
Purchase Details
Closed on
Nov 9, 2020
Sold by
Klinko Kris and Klinko Brian
Bought by
Tilley Cody and Tilley Emily
Current Estimated Value
Home Financials for this Owner
Home Financials are based on the most recent Mortgage that was taken out on this home.
Original Mortgage
$189,504
Outstanding Balance
$168,934
Interest Rate
2.9%
Mortgage Type
New Conventional
Estimated Equity
$109,749
Purchase Details
Closed on
May 13, 2015
Sold by
Underwood Olan T and Geron Bill
Bought by
Klinko Kris
Create a Home Valuation Report for This Property
The Home Valuation Report is an in-depth analysis detailing your home's value as well as a comparison with similar homes in the area
Home Values in the Area
Average Home Value in this Area
Purchase History
| Date | Buyer | Sale Price | Title Company |
|---|---|---|---|
| Tilley Cody | -- | Freedom Title | |
| Klinko Kris | -- | Lawyers Title |
Source: Public Records
Mortgage History
| Date | Status | Borrower | Loan Amount |
|---|---|---|---|
| Open | Tilley Cody | $189,504 |
Source: Public Records
Tax History
| Year | Tax Paid | Tax Assessment Tax Assessment Total Assessment is a certain percentage of the fair market value that is determined by local assessors to be the total taxable value of land and additions on the property. | Land | Improvement |
|---|---|---|---|---|
| 2025 | $2,627 | $185,000 | $70,594 | $114,406 |
| 2024 | $3,779 | $187,000 | $0 | $0 |
| 2023 | $2,288 | $170,000 | $54,906 | $115,094 |
| 2022 | $3,947 | $178,000 | $47,781 | $130,219 |
| 2021 | $3,752 | $178,509 | $39,094 | $139,415 |
| 2020 | $2,766 | $125,000 | $39,094 | $85,906 |
| 2019 | $2,960 | $130,000 | $39,094 | $90,906 |
| 2018 | $2,083 | $91,000 | $39,094 | $51,906 |
| 2017 | $1,897 | $82,500 | $39,094 | $43,406 |
| 2016 | $1,897 | $82,500 | $21,719 | $60,781 |
| 2015 | -- | $95,791 | $21,719 | $74,072 |
| 2013 | -- | $88,643 | $21,719 | $66,924 |
Source: Public Records
Map
Nearby Homes
Your Personal Tour Guide
Ask me questions while you tour the home.