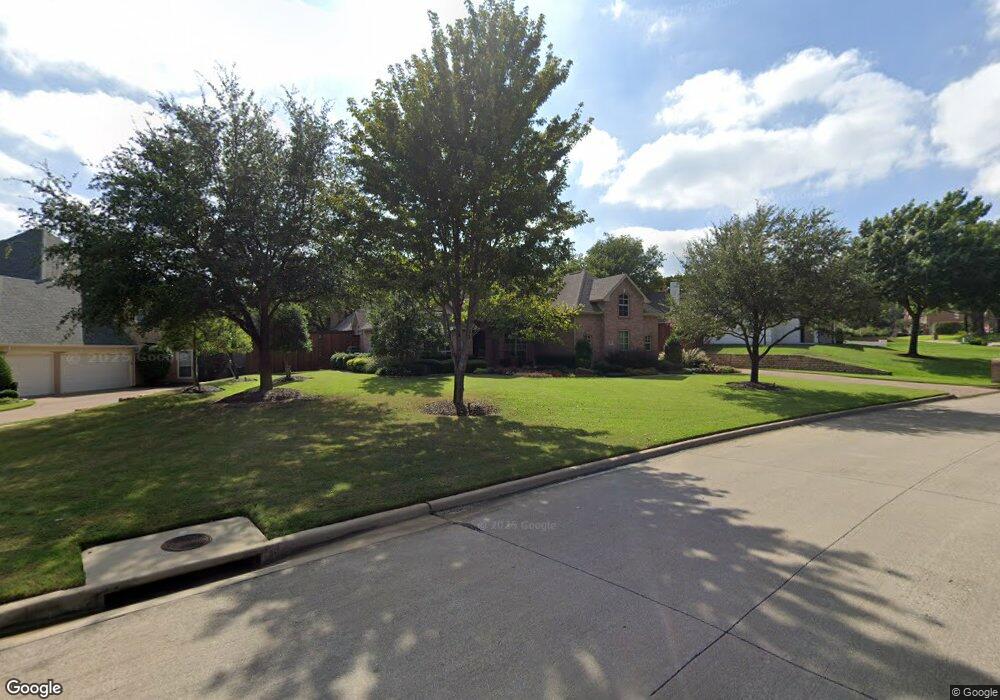
700 Shadow Glen Dr Southlake, TX 76092
Estimated Value: $1,190,000 - $1,380,000
4
Beds
3
Baths
4,070
Sq Ft
$318/Sq Ft
Est. Value
About This Home
This home is located at 700 Shadow Glen Dr, Southlake, TX 76092 and is currently estimated at $1,292,510, approximately $317 per square foot. 700 Shadow Glen Dr is a home located in Tarrant County with nearby schools including Robert High Rockenbaugh Elementary School, Eubanks Intermediate School, and George Dawson Middle School.
Ownership History
Date
Name
Owned For
Owner Type
Purchase Details
Closed on
Apr 30, 1997
Sold by
Pierce Homes Inc
Bought by
Meyer Bradford Scott and Meyer Joy Diane
Current Estimated Value
Home Financials for this Owner
Home Financials are based on the most recent Mortgage that was taken out on this home.
Original Mortgage
$214,600
Outstanding Balance
$29,189
Interest Rate
7.92%
Estimated Equity
$1,263,321
Purchase Details
Closed on
Mar 11, 1996
Sold by
Southlake Joint Venture
Bought by
Pierce Homes Inc
Home Financials for this Owner
Home Financials are based on the most recent Mortgage that was taken out on this home.
Original Mortgage
$235,120
Interest Rate
7.02%
Create a Home Valuation Report for This Property
The Home Valuation Report is an in-depth analysis detailing your home's value as well as a comparison with similar homes in the area
Home Values in the Area
Average Home Value in this Area
Purchase History
| Date | Buyer | Sale Price | Title Company |
|---|---|---|---|
| Meyer Bradford Scott | -- | Ticor Land Title | |
| Pierce Homes Inc | -- | Fidelity National Title Agen |
Source: Public Records
Mortgage History
| Date | Status | Borrower | Loan Amount |
|---|---|---|---|
| Open | Meyer Bradford Scott | $214,600 | |
| Previous Owner | Pierce Homes Inc | $235,120 |
Source: Public Records
Tax History Compared to Growth
Tax History
| Year | Tax Paid | Tax Assessment Tax Assessment Total Assessment is a certain percentage of the fair market value that is determined by local assessors to be the total taxable value of land and additions on the property. | Land | Improvement |
|---|---|---|---|---|
| 2025 | $14,211 | $1,165,744 | $273,225 | $892,519 |
| 2024 | $14,211 | $1,165,744 | $273,225 | $892,519 |
| 2023 | $16,133 | $1,190,792 | $273,225 | $917,567 |
| 2022 | $17,360 | $935,618 | $182,150 | $753,468 |
| 2021 | $16,678 | $759,898 | $182,150 | $577,748 |
| 2020 | $15,286 | $665,000 | $163,935 | $501,065 |
| 2019 | $17,168 | $708,971 | $150,000 | $558,971 |
| 2018 | $15,333 | $672,260 | $140,000 | $532,260 |
| 2017 | $16,393 | $661,377 | $125,000 | $536,377 |
| 2016 | $15,549 | $627,320 | $125,000 | $502,320 |
| 2015 | $13,420 | $602,676 | $95,000 | $507,676 |
| 2014 | $13,420 | $554,700 | $55,000 | $499,700 |
Source: Public Records
Map
Nearby Homes
- 800 Woodcrest Ct
- 806 Shadow Glen Dr
- 806 Ridgedale Ct
- 305 Canyon Lake Dr
- 102 Springbrook Ct
- 205 Edinburgh Ct
- 608 Stratford Dr
- 305 Sheffield Dr
- 802 Princeton Ct
- 351 S White Chapel Blvd
- 300 Shady Oaks Dr
- 203 Manor Place
- 221 Pine Dr
- 1196 W Continental Blvd
- 900 Kingsbury Way
- 204 Southridge Lakes Pkwy
- 403 Presidio Ct
- 1002 Chimney Hill Trail
- 903 San Saba Dr
- 1206 Oakwood Trail
- 404 Timber Lake Way
- 702 Shadow Glen Dr
- 705 Brookdale Ct
- 701 Shadow Glen Dr
- 704 Shadow Glen Dr
- 406 Timber Lake Way
- 703 Shadow Glen Dr
- 401 Timber Lake Way
- 707 Brookdale Ct
- 705 Shadow Glen Dr
- 405 Timber Lake Way
- 313 Timber Lake Way
- 308 Timber Lake Way
- 701 Brookdale Ct
- 800 Shadow Glen Dr
- 707 Shadow Glen Dr
- 407 Timber Lake Way
- 706 Brookdale Ct
- 801 Shadow Glen Dr
- 704 Lakehurst Ct