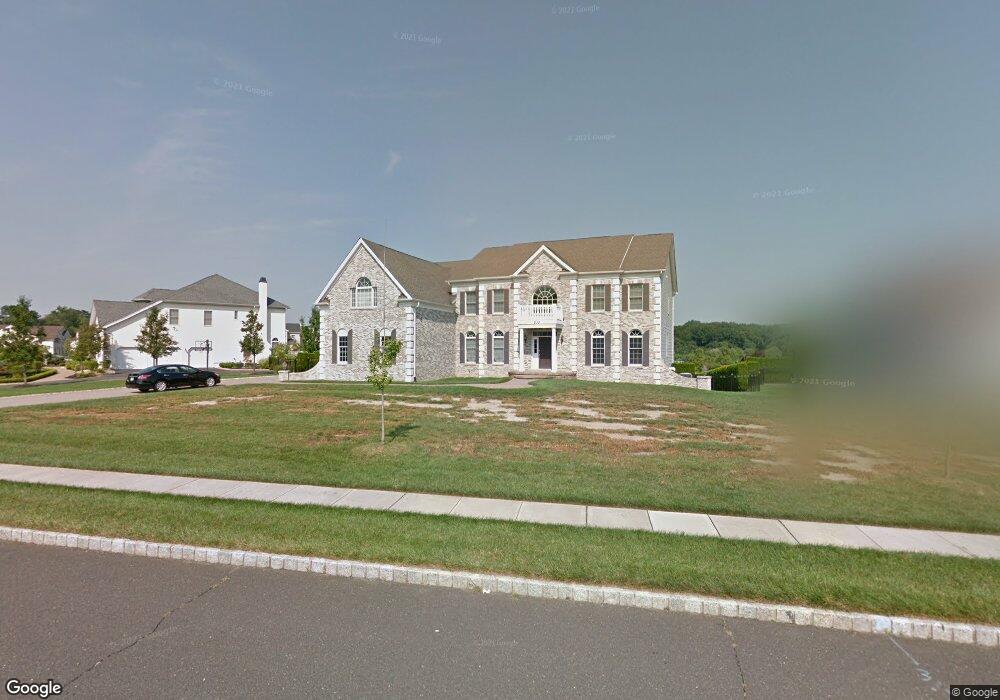
700 Silverleaf Way Manalapan, NJ 07726
Estimated Value: $1,807,000 - $1,926,000
6
Beds
5
Baths
5,246
Sq Ft
$358/Sq Ft
Est. Value
About This Home
This home is located at 700 Silverleaf Way, Manalapan, NJ 07726 and is currently estimated at $1,878,576, approximately $358 per square foot. 700 Silverleaf Way is a home located in Monmouth County with nearby schools including Clark Mills Elementary School, Pine Brook Elementary School, and Manalapan-Englishtown Middle School.
Ownership History
Date
Name
Owned For
Owner Type
Purchase Details
Closed on
Feb 13, 2019
Sold by
Perlamuter Yaroslav and Perlamuter Polina
Bought by
Lalima Jonathan and Lalima Laurin
Current Estimated Value
Home Financials for this Owner
Home Financials are based on the most recent Mortgage that was taken out on this home.
Original Mortgage
$674,001
Outstanding Balance
$591,359
Interest Rate
4.4%
Mortgage Type
New Conventional
Estimated Equity
$1,287,217
Purchase Details
Closed on
May 19, 2006
Sold by
Toll Nj Lp
Bought by
Perlamuter Yaroslav and Perlamuter Polina
Home Financials for this Owner
Home Financials are based on the most recent Mortgage that was taken out on this home.
Original Mortgage
$790,680
Interest Rate
6.75%
Mortgage Type
Adjustable Rate Mortgage/ARM
Create a Home Valuation Report for This Property
The Home Valuation Report is an in-depth analysis detailing your home's value as well as a comparison with similar homes in the area
Home Values in the Area
Average Home Value in this Area
Purchase History
| Date | Buyer | Sale Price | Title Company |
|---|---|---|---|
| Lalima Jonathan | $990,000 | Trident Abstract Ttl Agcy Ll | |
| Perlamuter Yaroslav | $988,350 | -- |
Source: Public Records
Mortgage History
| Date | Status | Borrower | Loan Amount |
|---|---|---|---|
| Open | Lalima Jonathan | $674,001 | |
| Previous Owner | Perlamuter Yaroslav | $790,680 |
Source: Public Records
Tax History Compared to Growth
Tax History
| Year | Tax Paid | Tax Assessment Tax Assessment Total Assessment is a certain percentage of the fair market value that is determined by local assessors to be the total taxable value of land and additions on the property. | Land | Improvement |
|---|---|---|---|---|
| 2025 | $25,968 | $1,561,400 | $505,000 | $1,056,400 |
| 2024 | $25,198 | $1,538,400 | $505,000 | $1,033,400 |
| 2023 | $25,198 | $1,514,300 | $505,000 | $1,009,300 |
| 2022 | $20,471 | $1,285,600 | $375,000 | $910,600 |
| 2021 | $20,471 | $986,100 | $170,000 | $816,100 |
| 2020 | $20,411 | $994,200 | $170,000 | $824,200 |
| 2019 | $20,569 | $1,000,900 | $195,000 | $805,900 |
| 2018 | $21,639 | $1,046,900 | $270,000 | $776,900 |
| 2017 | $21,396 | $1,035,600 | $280,000 | $755,600 |
| 2016 | $21,014 | $1,029,100 | $275,000 | $754,100 |
| 2015 | $21,540 | $1,043,600 | $301,200 | $742,400 |
| 2014 | $20,297 | $957,400 | $192,800 | $764,600 |
Source: Public Records
Map
Nearby Homes
- 2 Silverleaf Way
- 30 Shilling Rd
- 36 Merion Dr
- 8 Kensington Dr
- 432 Hampton Ct Unit 12-8
- 401 Hampton Ct
- 181 Arrowood Rd Unit D
- 1 Wickatunk Rd
- 154 Cross Slope Ct Unit G
- 204 Covered Bridge Blvd Unit F
- 184 Cross Slope Ct
- 8 Chesapeake Rd
- 210 Pine Brook Rd
- 12 Locust Grove Ln
- 86 Arrowood Rd Unit B
- 10 Locust Grove Ln
- 84 Amberly Dr Unit J
- 21 Wickatunk Rd
- 162 Cross Slope Ct Unit K
- 75 Overlook Way Unit K
- 600 Silverleaf Way
- 4 Silverleaf Way
- 200 Silverleaf Way
- 100 Silverleaf Way
- 500 Silverleaf Way
- 300 Silverleaf Way
- 6 Silverleaf Way
- 400 Silverleaf Way
- 4 Monticello Ct
- 6 Monticello Ct
- 1 Silverleaf Way
- 20 Elkridge Way
- 19 Elkridge Way
- 2 Monticello Ct
- 3 Silverleaf Way
- 17 Elkridge Way
- 18 Elkridge Way
- 8 Monticello Ct
- 5 Silverleaf Way
- 13 Elkridge Way