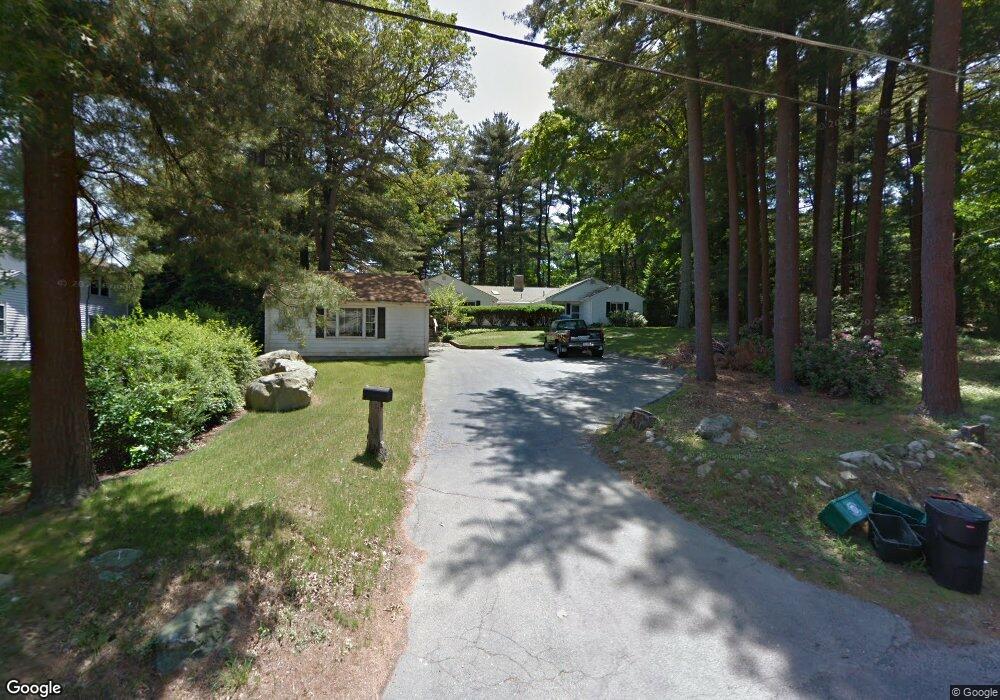
700 Torrey St Brockton, MA 02301
Estimated Value: $711,258 - $834,000
5
Beds
2
Baths
2,998
Sq Ft
$261/Sq Ft
Est. Value
About This Home
This home is located at 700 Torrey St, Brockton, MA 02301 and is currently estimated at $783,065, approximately $261 per square foot. 700 Torrey St is a home with nearby schools including Easton Middle School, Oliver Ames High School, and Dovecrest Montessori Academy.
Ownership History
Date
Name
Owned For
Owner Type
Purchase Details
Closed on
Sep 29, 2000
Sold by
Florio A John and Florio Virginia G
Bought by
Rivera Giuvel J and Natale-Rivera Leslie A
Current Estimated Value
Purchase Details
Closed on
Apr 30, 1998
Sold by
Inglis William T and Inglis Ann M
Bought by
Florio A John and Florios Virginia G
Create a Home Valuation Report for This Property
The Home Valuation Report is an in-depth analysis detailing your home's value as well as a comparison with similar homes in the area
Home Values in the Area
Average Home Value in this Area
Purchase History
| Date | Buyer | Sale Price | Title Company |
|---|---|---|---|
| Rivera Giuvel J | $237,000 | -- | |
| Florio A John | $175,000 | -- |
Source: Public Records
Mortgage History
| Date | Status | Borrower | Loan Amount |
|---|---|---|---|
| Open | Florio A John | $80,000 | |
| Open | Florio A John | $260,500 | |
| Closed | Florio A John | $243,750 |
Source: Public Records
Tax History Compared to Growth
Tax History
| Year | Tax Paid | Tax Assessment Tax Assessment Total Assessment is a certain percentage of the fair market value that is determined by local assessors to be the total taxable value of land and additions on the property. | Land | Improvement |
|---|---|---|---|---|
| 2025 | $7,420 | $612,700 | $187,900 | $424,800 |
| 2024 | $6,924 | $576,000 | $187,900 | $388,100 |
| 2023 | $6,708 | $516,800 | $155,700 | $361,100 |
| 2022 | $6,815 | $487,800 | $142,900 | $344,900 |
| 2021 | $6,276 | $432,800 | $122,200 | $310,600 |
| 2020 | $6,716 | $443,300 | $117,000 | $326,300 |
| 2019 | $5,932 | $381,700 | $107,500 | $274,200 |
| 2018 | $6,072 | $378,100 | $107,500 | $270,600 |
| 2017 | $5,886 | $365,600 | $107,500 | $258,100 |
| 2016 | $5,767 | $332,200 | $104,900 | $227,300 |
| 2015 | $5,548 | $305,700 | $104,900 | $200,800 |
| 2014 | $5,809 | $320,400 | $104,900 | $215,500 |
Source: Public Records
Map
Nearby Homes