Estimated Value: $632,000 - $1,669,000
--
Bed
--
Bath
2,632
Sq Ft
$396/Sq Ft
Est. Value
About This Home
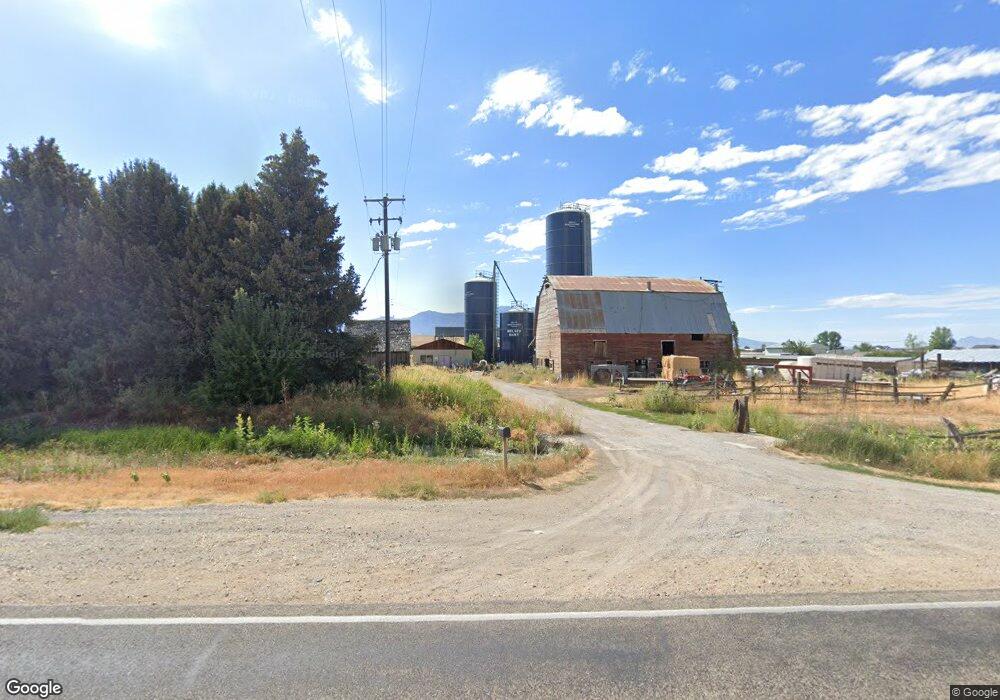
This home is located at 7000 Hwy 165, Hyrum, UT 84319 and is currently estimated at $1,042,150, approximately $395 per square foot. 7000 Hwy 165 is a home located in Cache County with nearby schools including Canyon School, South Cache Middle School, and Mountain Crest High School.
Ownership History
Date
Name
Owned For
Owner Type
Purchase Details
Closed on
Mar 13, 2018
Sold by
Alliance Holdings Llc
Bought by
Alliance Holdings Llc
Current Estimated Value
Purchase Details
Closed on
Nov 22, 2017
Sold by
Alliance Holding Llc
Bought by
Alliance Holding Llc
Purchase Details
Closed on
Mar 8, 2017
Sold by
Andrews Mark and Andrews Heather
Bought by
Alliance Holdings Llc
Purchase Details
Closed on
Oct 18, 2006
Sold by
Nielsen Clyde C C
Bought by
Day Bruce and Andrews Mark
Create a Home Valuation Report for This Property
The Home Valuation Report is an in-depth analysis detailing your home's value as well as a comparison with similar homes in the area
Home Values in the Area
Average Home Value in this Area
Purchase History
| Date | Buyer | Sale Price | Title Company |
|---|---|---|---|
| Alliance Holdings Llc | -- | -- | |
| Alliance Holding Llc | -- | -- | |
| Alliance Holdings Llc | -- | None Available | |
| Day Bruce | -- | American Secure Title |
Source: Public Records
Tax History Compared to Growth
Tax History
| Year | Tax Paid | Tax Assessment Tax Assessment Total Assessment is a certain percentage of the fair market value that is determined by local assessors to be the total taxable value of land and additions on the property. | Land | Improvement |
|---|---|---|---|---|
| 2025 | $2,647 | $432,685 | $0 | $0 |
| 2024 | $2,753 | $416,380 | $0 | $0 |
| 2023 | $2,933 | $415,035 | $0 | $0 |
| 2022 | $3,070 | $415,035 | $0 | $0 |
| 2021 | $2,681 | $732,840 | $295,150 | $437,690 |
| 2020 | $2,550 | $675,750 | $295,150 | $380,600 |
| 2019 | $2,402 | $568,225 | $187,625 | $380,600 |
| 2018 | $53 | $598,779 | $598,779 | $0 |
| 2017 | $156 | $14,890 | $0 | $0 |
| 2016 | $158 | $14,755 | $0 | $0 |
| 2015 | $155 | $14,620 | $0 | $0 |
| 2014 | $157 | $15,315 | $0 | $0 |
| 2013 | -- | $16,210 | $0 | $0 |
Source: Public Records
Map
Nearby Homes
- 200 E 7000 S
- 760 E 1250 S
- 730 E 1250 S
- 746 E 1250 S
- 685 E 1250 S
- Ashland Plan at Canyon Estates
- Magnolia Plan at Canyon Estates
- Richmond Plan at Canyon Estates
- 1158 S 650 E
- 676 E 1100 S
- 667 E 730 N
- 8 S 650 W
- 42 the Hideout at Scare
- 7500 S 1400 W
- 478 S 1170 E
- 516 S 770 E
- 412 S 1170 E
- 1502 E 440 S
- 515 W 8000 S
- 430 S 1540 E
- 7000 Highway 165
- 200 S 7000
- 7050 Utah 165
- 258 E 6600 S
- 430 E 6600 S
- 366 E 6600 S
- 386 E 6600 S
- 7350 Highway 165
- 7035 Highway 165
- 6991 Highway 165
- 6907 S Highway 165
- 7215 Utah 165
- 7215 Highway 165
- 7235 S Hwy 165 E Unit 5
- 6911 S Highway 165
- 650 E 6600 S
- 6845 Highway 165
- 7269 Highway 165
- 18 W 7400 S
- 7245 S Highway 165