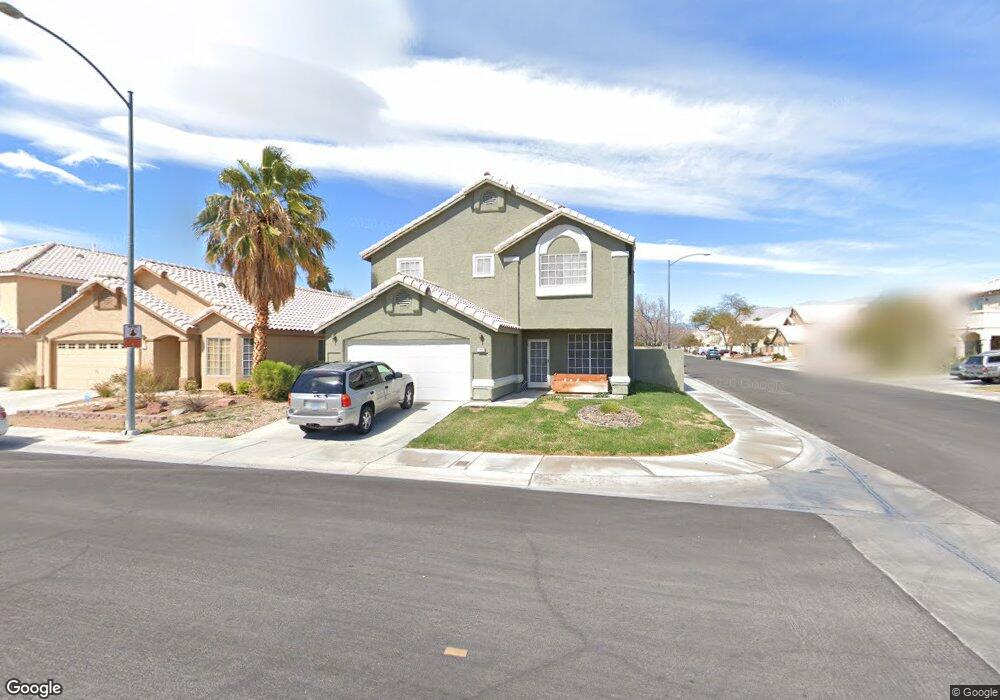
7000 Magic Window Ave Las Vegas, NV 89130
Estimated Value: $372,000 - $471,000
4
Beds
3
Baths
2,076
Sq Ft
$209/Sq Ft
Est. Value
About This Home
This home is located at 7000 Magic Window Ave, Las Vegas, NV 89130 and is currently estimated at $432,949, approximately $208 per square foot. 7000 Magic Window Ave is a home located in Clark County with nearby schools including Joseph M Neal Elementary School, Anthony Saville Middle School, and Shadow Ridge High School.
Ownership History
Date
Name
Owned For
Owner Type
Purchase Details
Closed on
Jul 27, 2018
Sold by
Pregress Residential Equity Owner 4 Llc
Bought by
Progress Residential Borrower 4 Llc
Current Estimated Value
Purchase Details
Closed on
May 7, 2018
Sold by
Zabel Karl F
Bought by
Property Owners 5 Llc
Purchase Details
Closed on
Mar 7, 2017
Sold by
Zabel Kristi L
Bought by
Zabel Karl F
Purchase Details
Closed on
Mar 18, 1996
Sold by
Friday Estates Inc
Bought by
Zabel Karl F and Zabel Kristi L
Home Financials for this Owner
Home Financials are based on the most recent Mortgage that was taken out on this home.
Original Mortgage
$123,364
Interest Rate
7.01%
Mortgage Type
FHA
Create a Home Valuation Report for This Property
The Home Valuation Report is an in-depth analysis detailing your home's value as well as a comparison with similar homes in the area
Home Values in the Area
Average Home Value in this Area
Purchase History
| Date | Buyer | Sale Price | Title Company |
|---|---|---|---|
| Progress Residential Borrower 4 Llc | -- | Os National Llc | |
| Progress Residntial Equity Owner 4 Llc | -- | Os National | |
| P2 Intermediate Sfr Holdings Llc | -- | Os National | |
| P2 Sfr Holdings Llc | -- | Os National | |
| P2 Hold Partnership A Lp | -- | Os National | |
| P2 Trust | -- | Os National | |
| Progress Residential Borrower 4 Llc | -- | Os National | |
| Property Owners 5 Llc | $210,000 | First American Title Insu | |
| Zabel Karl F | -- | None Available | |
| Zabel Karl F | $125,500 | Fidelity National Title |
Source: Public Records
Mortgage History
| Date | Status | Borrower | Loan Amount |
|---|---|---|---|
| Previous Owner | Zabel Karl F | $123,364 |
Source: Public Records
Tax History Compared to Growth
Tax History
| Year | Tax Paid | Tax Assessment Tax Assessment Total Assessment is a certain percentage of the fair market value that is determined by local assessors to be the total taxable value of land and additions on the property. | Land | Improvement |
|---|---|---|---|---|
| 2025 | $2,099 | $101,713 | $33,600 | $68,113 |
| 2024 | $1,944 | $101,713 | $33,600 | $68,113 |
| 2023 | $1,944 | $96,325 | $31,500 | $64,825 |
| 2022 | $1,800 | $84,129 | $24,850 | $59,279 |
| 2021 | $1,667 | $80,047 | $23,450 | $56,597 |
| 2020 | $1,545 | $79,703 | $23,450 | $56,253 |
| 2019 | $1,448 | $74,414 | $18,900 | $55,514 |
| 2018 | $1,382 | $69,031 | $15,750 | $53,281 |
| 2017 | $2,232 | $68,087 | $14,000 | $54,087 |
| 2016 | $1,294 | $60,598 | $10,150 | $50,448 |
| 2015 | $1,291 | $49,326 | $7,000 | $42,326 |
| 2014 | $1,253 | $41,208 | $7,000 | $34,208 |
Source: Public Records
Map
Nearby Homes
- 5921 Royal Castle Ln
- 5966 Rio Vista St
- 6900 Cloudy Ridge Ct
- 0 Rio Vista St
- 7237 Grand Palace Ave
- 7101 Utopia Way
- 5667 Foxglove Field St
- 5817 Grand Heritage St
- 5821 Grand Heritage St
- 5816 Grand Heritage St
- 5836 Round Castle St
- 5663 N Balsam St
- 5912 Grand Heritage St
- 5917 Kane Holly St
- 6009 Blowing Bellows St
- 5730 Sky Pointe Dr Unit 165
- 6805 Silver Chisel Ave
- 6131 Rio Vista St
- 5901 Silver Heights St
- 6113 Iron Kettle St
- 7004 Magic Window Ave
- 7001 Rotunda Ct
- 7008 Magic Window Ave
- 5724 Emperor Way
- 5800 Emperor Way
- 7009 Rotunda Ct
- 7001 Magic Window Ave
- 7005 Magic Window Ave
- 5720 Emperor Way
- 5756 Royal Castle Ln
- 5760 Royal Castle Ln
- 7009 Magic Window Ave
- 5804 Emperor Way
- 5764 Royal Castle Ln
- 5800 Royal Castle Ln
- 5748 Royal Castle Ln
- 5716 Emperor Way
- 7000 Resplendent Ct
- 5804 Royal Castle Ln