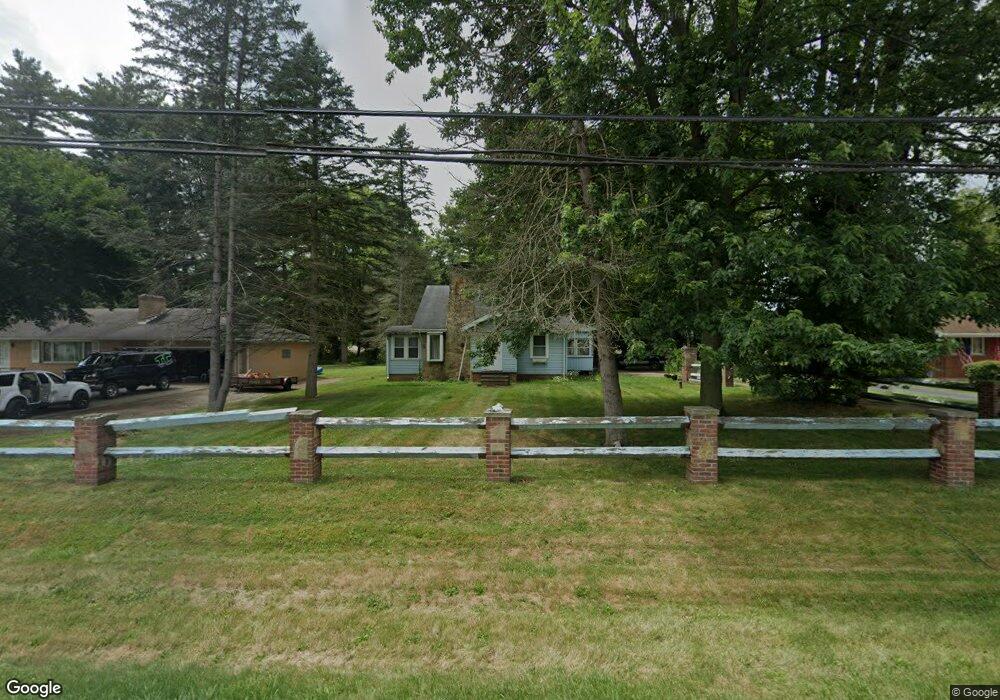
7001 Middlebranch Ave NE Canton, OH 44721
Estimated Value: $137,000 - $242,000
3
Beds
1
Bath
1,598
Sq Ft
$116/Sq Ft
Est. Value
About This Home
This home is located at 7001 Middlebranch Ave NE, Canton, OH 44721 and is currently estimated at $185,943, approximately $116 per square foot. 7001 Middlebranch Ave NE is a home located in Stark County with nearby schools including Middlebranch Elementary School, Oakwood Middle School, and GlenOak High School.
Ownership History
Date
Name
Owned For
Owner Type
Purchase Details
Closed on
Apr 2, 2018
Sold by
Davis Jeffrey C
Bought by
Davis Michele K
Current Estimated Value
Purchase Details
Closed on
Apr 28, 2005
Sold by
Dayspring Christian Fellowship Inc
Bought by
Davis Jeffrey C and Davis Michele
Home Financials for this Owner
Home Financials are based on the most recent Mortgage that was taken out on this home.
Original Mortgage
$113,905
Outstanding Balance
$71,681
Interest Rate
9.25%
Mortgage Type
New Conventional
Estimated Equity
$114,262
Purchase Details
Closed on
Jan 19, 2004
Sold by
Boli Pam
Bought by
Richmann Joan
Purchase Details
Closed on
Dec 3, 2003
Sold by
Estate Of Cheri Brendlen
Bought by
Brendlen Thomas
Purchase Details
Closed on
May 29, 2003
Sold by
Estate Of Esther Marie Brendlen
Bought by
Brendlen Thomas and Brendlin Cheri
Create a Home Valuation Report for This Property
The Home Valuation Report is an in-depth analysis detailing your home's value as well as a comparison with similar homes in the area
Home Values in the Area
Average Home Value in this Area
Purchase History
| Date | Buyer | Sale Price | Title Company |
|---|---|---|---|
| Davis Michele K | -- | None Available | |
| Davis Jeffrey C | $119,900 | -- | |
| Richmann Joan | $63,000 | Americas Choice Title Agency | |
| Brendlen Thomas | -- | -- | |
| Brendlen Thomas | -- | -- |
Source: Public Records
Mortgage History
| Date | Status | Borrower | Loan Amount |
|---|---|---|---|
| Open | Davis Jeffrey C | $113,905 |
Source: Public Records
Tax History Compared to Growth
Tax History
| Year | Tax Paid | Tax Assessment Tax Assessment Total Assessment is a certain percentage of the fair market value that is determined by local assessors to be the total taxable value of land and additions on the property. | Land | Improvement |
|---|---|---|---|---|
| 2025 | -- | $37,520 | $9,590 | $27,930 |
| 2024 | -- | $37,520 | $9,590 | $27,930 |
| 2023 | $1,258 | $26,430 | $5,360 | $21,070 |
| 2022 | $1,262 | $26,430 | $5,360 | $21,070 |
| 2021 | $1,268 | $26,430 | $5,360 | $21,070 |
| 2020 | $1,229 | $23,170 | $4,620 | $18,550 |
| 2019 | $1,220 | $23,170 | $4,620 | $18,550 |
| 2018 | $1,176 | $23,170 | $4,620 | $18,550 |
| 2017 | $1,103 | $19,960 | $4,520 | $15,440 |
| 2016 | $1,106 | $19,960 | $4,520 | $15,440 |
| 2015 | $1,069 | $19,960 | $4,520 | $15,440 |
| 2014 | $1,009 | $18,420 | $4,170 | $14,250 |
| 2013 | $494 | $18,420 | $4,170 | $14,250 |
Source: Public Records
Map
Nearby Homes
- 6807 Sun Valley Ave NE
- 7192 Middlebranch Ave NE
- 6930 Firestone Rd NE
- 6731 Amsel Ave NE
- 6666 Carriage Lane Ave NE
- 7431 Middlebranch Ave NE
- 6880 Birchbark Ave NE
- 1847 Woodthrush St NE
- 7099 Fenwick Ave NE
- 6402 Blossomwood Cir NE
- 7606 Knollridge Ave NE
- 6473 Saint Leger Ave NE
- 6684 Leestone Ave NE
- 3461 Donegal Dr NE
- 6533 Pine Bluff Ave NE
- 1544 Gate House St NE
- 1524 Eagle Watch St NE
- 6914 Stonecreek Ave NE
- 1614 Bellview St NE
- 6090 Wiclif St NE
- 7021 Middlebranch Ave NE
- 6991 Middlebranch Ave NE
- 6980 Middlebranch Ave NE
- 6980 Middlebranch Ave NE
- 7008 Middlebranch Ave NE
- 6961 Middlebranch Ave NE
- 7043 Middlebranch Ave NE
- 7040 Middlebranch Ave NE
- 6931 Middlebranch Ave NE
- 7087 Middlebranch Ave NE
- 7030 Firestone Ave NE
- 6909 Middlebranch Ave NE
- 7099 Middlebranch Ave NE
- 6886 Sun Valley Ave NE
- 6893 Middlebranch Ave NE
- 6893 6895 Middlebranch Ave NE
- 6877 Sun Valley Ave NE
- 7000 Firestone Ave NE
- 6875 Middlebranch Ave NE
- 6876 Middlebranch Ave NE