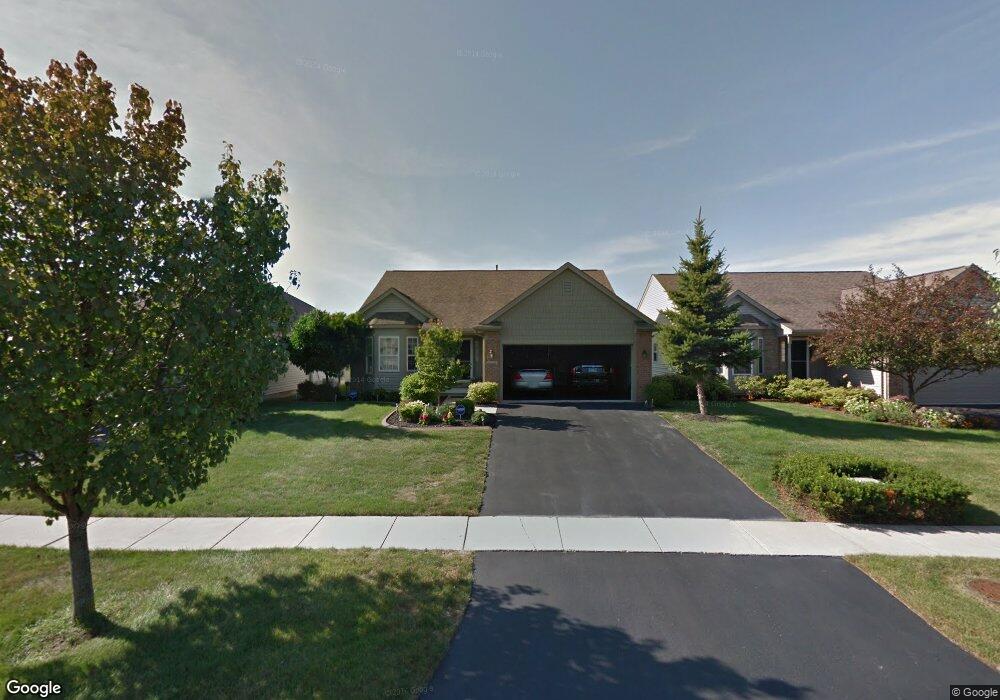
7001 Shoreview Ct Maumee, OH 43537
Estimated Value: $349,896 - $379,000
2
Beds
2
Baths
1,488
Sq Ft
$245/Sq Ft
Est. Value
About This Home
This home is located at 7001 Shoreview Ct, Maumee, OH 43537 and is currently estimated at $365,224, approximately $245 per square foot. 7001 Shoreview Ct is a home located in Lucas County with nearby schools including Anthony Wayne High School, St Joseph Catholic School, and Monclova Christian Academy.
Ownership History
Date
Name
Owned For
Owner Type
Purchase Details
Closed on
Nov 20, 2009
Sold by
Dirr Loren L and Dirr Susan J
Bought by
Butler David A and Butler Grace A
Current Estimated Value
Home Financials for this Owner
Home Financials are based on the most recent Mortgage that was taken out on this home.
Original Mortgage
$72,000
Interest Rate
5.05%
Mortgage Type
New Conventional
Purchase Details
Closed on
Dec 28, 2004
Sold by
Dirr Loren L
Bought by
Dirr Loren L and Dirr Susan J
Purchase Details
Closed on
Feb 17, 2000
Sold by
Louisville Title Agency For Nw Ohio Inc
Bought by
Dirr Loren L and Dirr Marilyn
Home Financials for this Owner
Home Financials are based on the most recent Mortgage that was taken out on this home.
Original Mortgage
$154,208
Outstanding Balance
$56,964
Interest Rate
7.5%
Estimated Equity
$308,260
Create a Home Valuation Report for This Property
The Home Valuation Report is an in-depth analysis detailing your home's value as well as a comparison with similar homes in the area
Home Values in the Area
Average Home Value in this Area
Purchase History
| Date | Buyer | Sale Price | Title Company |
|---|---|---|---|
| Butler David A | $213,000 | Louisville Title Agency For | |
| Dirr Loren L | -- | -- | |
| Dirr Loren L | $46,800 | Louisville Title Agency For |
Source: Public Records
Mortgage History
| Date | Status | Borrower | Loan Amount |
|---|---|---|---|
| Closed | Butler David A | $72,000 | |
| Open | Dirr Loren L | $154,208 |
Source: Public Records
Tax History Compared to Growth
Tax History
| Year | Tax Paid | Tax Assessment Tax Assessment Total Assessment is a certain percentage of the fair market value that is determined by local assessors to be the total taxable value of land and additions on the property. | Land | Improvement |
|---|---|---|---|---|
| 2024 | $3,152 | $121,345 | $30,625 | $90,720 |
| 2023 | $5,368 | $92,190 | $23,730 | $68,460 |
| 2022 | $5,394 | $92,190 | $23,730 | $68,460 |
| 2021 | $5,280 | $92,190 | $23,730 | $68,460 |
| 2020 | $5,076 | $79,380 | $19,915 | $59,465 |
| 2019 | $4,933 | $79,380 | $19,915 | $59,465 |
| 2018 | $4,544 | $79,380 | $19,915 | $59,465 |
| 2017 | $4,399 | $66,850 | $19,425 | $47,425 |
| 2016 | $4,357 | $191,000 | $55,500 | $135,500 |
| 2015 | $4,176 | $191,000 | $55,500 | $135,500 |
| 2014 | $4,012 | $64,930 | $18,870 | $46,060 |
| 2013 | $4,012 | $64,930 | $18,870 | $46,060 |
Source: Public Records
Map
Nearby Homes
- 6958 Longwater Dr
- 7342 Harbour Light Ct
- 4339 Sage St
- 4351 Sage St
- 4402 Sage St
- 4332 Sage St
- 6621 Monclova Rd
- 7250 Violet Ln
- 4335 Crystal Ridge Dr E
- 6740 Monclova Rd
- 7231 Rolling Meadow Ln
- 5120 Lake Breeze Ln
- 4228 Crystal Ridge Dr E
- 4455 Post Office Cir
- 7465 Peppergrass Crossing
- 4369 Post Office Cir
- 4352 Post Office Cir
- 4346 Post Office Cir
- 4340 Post Office Cir
- 4334 Post Office Cir
- 6963 Shoreview Ct
- 7007 Shoreview Ct
- 6957 Shoreview Ct
- 7013 Shoreview Ct
- 4748 Port Dr
- 6951 Shoreview Ct
- 7019 Shoreview Ct
- 4754 Port Dr
- 6964 Shoreview Ct
- 7000 Shoreview Ct
- 6962 Shoreview Ct
- 7006 Shoreview Ct
- 6956 Shoreview Ct
- 4760 Port Dr
- 7025 Shoreview Ct
- 7012 Shoreview Ct
- 6950 Shoreview Ct
- 4766 Port Dr
- 7031 Shoreview Ct
- 7018 Shoreview Ct