Estimated Value: $235,615 - $291,000
2
Beds
2
Baths
816
Sq Ft
$330/Sq Ft
Est. Value
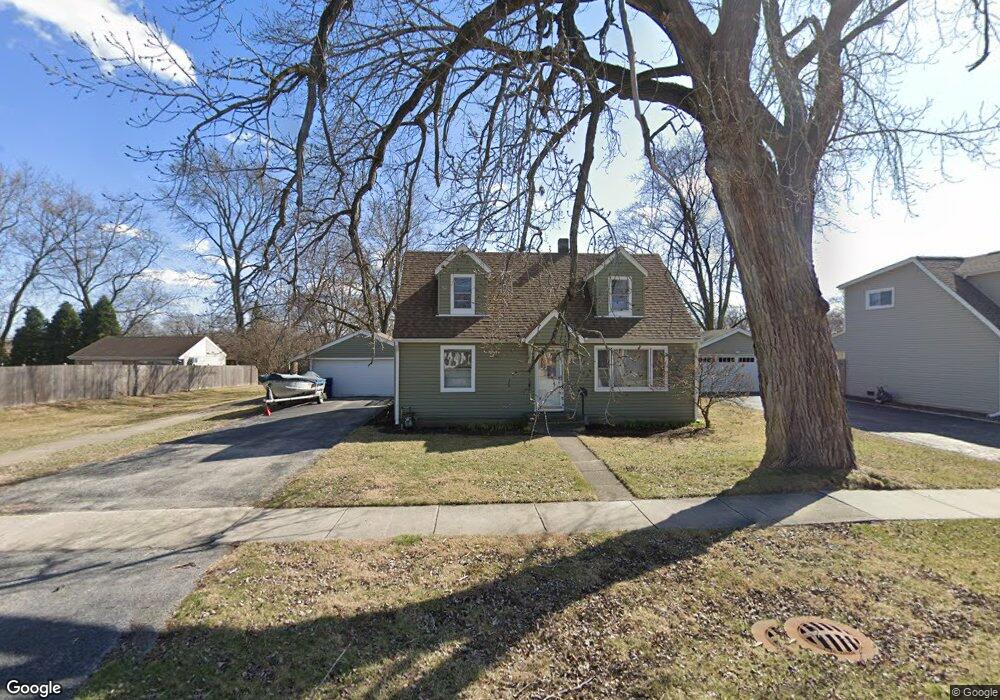
About This Home
This home is located at 7001 W 115th St, Worth, IL 60482 and is currently estimated at $269,654, approximately $330 per square foot. 7001 W 115th St is a home located in Cook County with nearby schools including Worth Elementary School, Worth Jr High School, and A B Shepard High School.
Ownership History
Date
Name
Owned For
Owner Type
Purchase Details
Closed on
Jan 17, 2002
Sold by
Brauer Joseph A and Brauer Erin K
Bought by
Borg Warren W
Current Estimated Value
Home Financials for this Owner
Home Financials are based on the most recent Mortgage that was taken out on this home.
Original Mortgage
$126,500
Outstanding Balance
$50,420
Interest Rate
7.14%
Estimated Equity
$219,234
Purchase Details
Closed on
Nov 20, 2000
Sold by
Carey John P and Borg Warren W
Bought by
Borg Warren W and Brauer Joseph A
Home Financials for this Owner
Home Financials are based on the most recent Mortgage that was taken out on this home.
Original Mortgage
$126,000
Interest Rate
7.86%
Purchase Details
Closed on
Jul 30, 1996
Sold by
Syverson Theodore and Syverson Mary K
Bought by
Carey John P and Borg Warren W
Home Financials for this Owner
Home Financials are based on the most recent Mortgage that was taken out on this home.
Original Mortgage
$122,137
Interest Rate
8.33%
Mortgage Type
FHA
Create a Home Valuation Report for This Property
The Home Valuation Report is an in-depth analysis detailing your home's value as well as a comparison with similar homes in the area
Home Values in the Area
Average Home Value in this Area
Purchase History
| Date | Buyer | Sale Price | Title Company |
|---|---|---|---|
| Borg Warren W | -- | -- | |
| Borg Warren W | -- | Ticor Title | |
| Carey John P | $123,500 | -- |
Source: Public Records
Mortgage History
| Date | Status | Borrower | Loan Amount |
|---|---|---|---|
| Open | Borg Warren W | $126,500 | |
| Closed | Borg Warren W | $126,000 | |
| Closed | Carey John P | $122,137 |
Source: Public Records
Tax History
| Year | Tax Paid | Tax Assessment Tax Assessment Total Assessment is a certain percentage of the fair market value that is determined by local assessors to be the total taxable value of land and additions on the property. | Land | Improvement |
|---|---|---|---|---|
| 2025 | $5,973 | $17,948 | $5,177 | $12,771 |
| 2024 | $5,973 | $17,948 | $5,177 | $12,771 |
| 2023 | $4,587 | $20,000 | $5,177 | $14,823 |
| 2022 | $4,587 | $14,296 | $4,530 | $9,766 |
| 2021 | $4,450 | $14,294 | $4,529 | $9,765 |
| 2020 | $4,441 | $14,294 | $4,529 | $9,765 |
| 2019 | $4,620 | $14,437 | $4,098 | $10,339 |
| 2018 | $4,598 | $14,437 | $4,098 | $10,339 |
| 2017 | $4,621 | $14,437 | $4,098 | $10,339 |
| 2016 | $4,584 | $12,740 | $3,451 | $9,289 |
| 2015 | $4,445 | $12,740 | $3,451 | $9,289 |
| 2014 | $4,380 | $12,740 | $3,451 | $9,289 |
| 2013 | $4,849 | $15,127 | $3,451 | $11,676 |
Source: Public Records
Map
Nearby Homes
- 6935 W 115th Place
- 6743 W 115th St
- 6837 W 113th St
- 6732 W 113th Place
- 11245 S Harlem Ave Unit A12
- 11913 S 71st Ct
- 11334 S Nashville Ave
- 11326 S Nashville Ave
- 11943 S 70th Ct
- 11410 S Neenah Ave
- 11519 S Neenah Ave
- 7400 W 113th Place
- 11257 S Pacific Dr
- 6532 W 112th St
- 6429 W 114th St
- 7010 W 110th St Unit 6
- 7201 W 110th St
- 11524 S Ridgeland Ave
- 11241 S Nagle Ave
- 12039 S 74th Ave
- 7009 W 115th St
- 6935 W 115th St
- 7000 W 115th Place
- 7000 W 115th Place
- 6934 W 115th Place
- 7013 W 115th St
- 7013 W 115th St
- 7010 W 115th Place
- 6927 W 115th St
- 7023 W 115th St
- 7023 W 115th St
- 7000 W 115th St
- 7002 W 115th St
- 7006 W 115th St
- 7014 W 115th Place
- 6926 W 115th Place
- 6928 W 115th St
- 7012 W 115th St
- 6919 W 115th St
- 7018 W 115th St
Your Personal Tour Guide
Ask me questions while you tour the home.