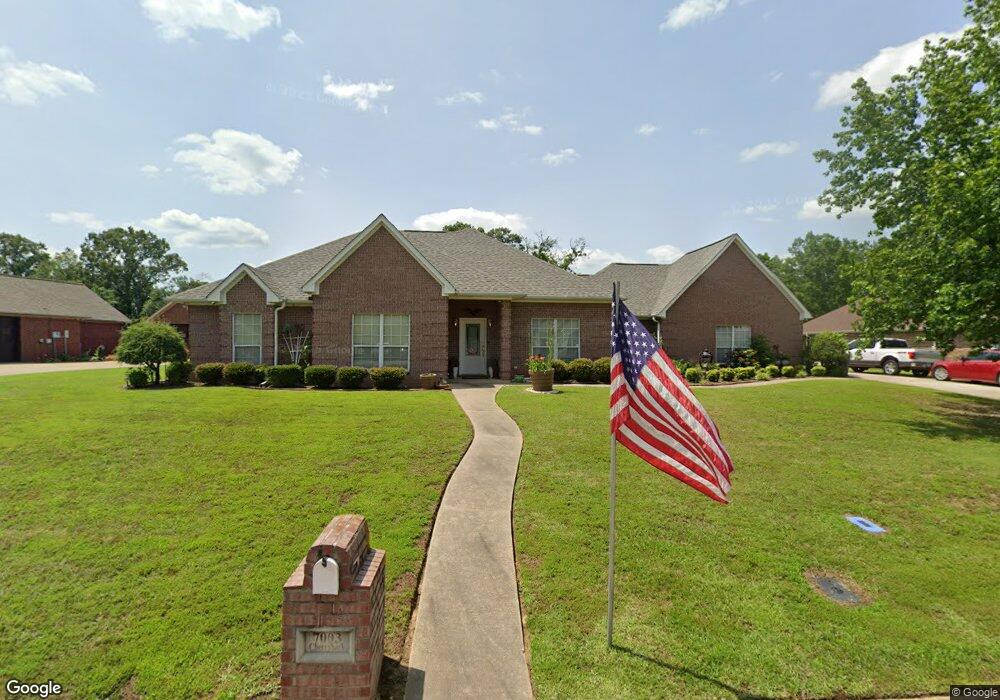
7003 Cherrybark Cir Texarkana, AR 71854
Estimated Value: $356,877 - $415,000
Studio
2
Baths
2,309
Sq Ft
$171/Sq Ft
Est. Value
About This Home
This home is located at 7003 Cherrybark Cir, Texarkana, AR 71854 and is currently estimated at $394,969, approximately $171 per square foot. 7003 Cherrybark Cir is a home located in Miller County with nearby schools including Arkansas High School, Trinity Christian School, and Veritas Academy.
Ownership History
Date
Name
Owned For
Owner Type
Purchase Details
Closed on
Oct 30, 2014
Sold by
Dansby Craig
Bought by
Dansby Thurmon and Dansby Dorothy
Current Estimated Value
Purchase Details
Closed on
Aug 20, 2012
Sold by
Dansby Thurmon D
Bought by
Dansby Craig J
Purchase Details
Closed on
Dec 10, 2011
Bought by
Dansby Dorothy and Dansby Thurman
Purchase Details
Closed on
Dec 16, 2009
Sold by
Dansby Myron
Bought by
Dansby Thurmon
Purchase Details
Closed on
Oct 23, 2003
Bought by
Dansby Dorothy Smith
Purchase Details
Closed on
Feb 14, 2003
Bought by
Bruce Verlin Willie and Bruce Leroy
Purchase Details
Closed on
Oct 4, 2002
Bought by
Dansby Myron D and Dansby Smith,Dorothy
Purchase Details
Closed on
Jul 29, 2002
Bought by
Dansby Myron D
Purchase Details
Closed on
Feb 28, 2000
Bought by
Dansby Thurmon and Dansby Smith,Dorothy
Create a Home Valuation Report for This Property
The Home Valuation Report is an in-depth analysis detailing your home's value as well as a comparison with similar homes in the area
Purchase History
| Date | Buyer | Sale Price | Title Company |
|---|---|---|---|
| Dansby Thurmon | -- | -- | |
| Dansby Craig J | -- | None Available | |
| Dansby Dorothy | -- | -- | |
| Dansby Thurmon | -- | None Available | |
| Dansby Dorothy Smith | -- | -- | |
| Bruce Verlin Willie | -- | -- | |
| Dansby Myron D | -- | -- | |
| Dansby Myron D | -- | -- | |
| Dansby Thurmon | $178,000 | -- |
Source: Public Records
Tax History
| Year | Tax Paid | Tax Assessment Tax Assessment Total Assessment is a certain percentage of the fair market value that is determined by local assessors to be the total taxable value of land and additions on the property. | Land | Improvement |
|---|---|---|---|---|
| 2025 | $3,273 | $69,750 | $11,440 | $58,310 |
| 2024 | $2,976 | $51,840 | $11,440 | $40,400 |
| 2023 | $2,846 | $51,840 | $11,440 | $40,400 |
| 2022 | $2,846 | $51,840 | $11,440 | $40,400 |
| 2021 | $2,846 | $51,840 | $11,440 | $40,400 |
| 2020 | $1,581 | $51,840 | $11,440 | $40,400 |
| 2019 | $1,581 | $49,640 | $11,440 | $38,200 |
| 2018 | $1,606 | $49,640 | $11,440 | $38,200 |
| 2017 | $1,606 | $49,640 | $11,440 | $38,200 |
| 2016 | $1,606 | $35,620 | $6,600 | $29,020 |
| 2015 | $1,606 | $35,620 | $6,600 | $29,020 |
| 2014 | -- | $35,620 | $6,600 | $29,020 |
Source: Public Records
Map
Nearby Homes
- 6904 Cherrybark Cir
- TBD Sugar Hill Rd
- 9 Northern Hills Place
- 7102 Forest Oak Dr
- 6708 Wuthering Heights Ln
- TBD 80 acres Arkansas 296
- 7405 Johna Cir
- 7005 Forest Oak Dr
- 4103 Jack Cullen Dr
- 7102 Live Oak Dr
- 6902 Live Oak Dr
- 3410 Water Oak Dr
- 7005 Tall Oaks
- 7101 Tall Oaks
- 6516 Wuthering Heights Ln
- 6923 Sugarland Dr
- 3620 Northern Red Oak Trail
- 3517 Northern Red Oak Trail
- 6207 River Birch Way
- 3508 Southern Magnolia Ln
- 7007 Cherrybark Cir
- 6915 Cherrybark Cir
- 7004 Cherrybark Cir
- 7011 Cherrybark Cir
- 6911 Cherrybark Cir
- 6914 Cherrybark Cir
- 7008 Cherrybark Cir
- 7012 Cherrybark Cir
- 0 Cherrybark Cir
- 6910 Cherrybark Cir
- 6907 Cherrybark Cir
- 4002 Water Oak Dr
- 3910 Water Oak
- 3910 Water Oak Dr
- 3811 Sugar Hill Rd
- 7106 Water Oak Cir
- 3906 Water Oak Dr
- 43.07 Acres Sugar Hill Rd
- 4102 Water Oak Dr
- 7105 Water Oak Cir
Your Personal Tour Guide
Ask me questions while you tour the home.