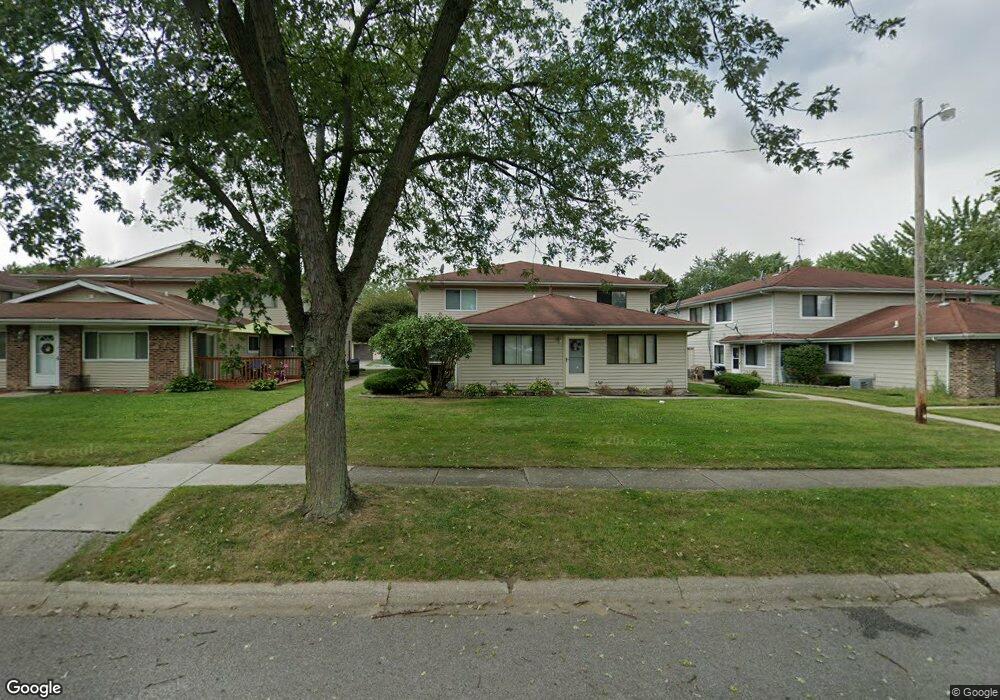
7004 Fillmore Dr Merrillville, IN 46410
Turkey Creek NeighborhoodEstimated Value: $100,000 - $305,000
2
Beds
1
Bath
725
Sq Ft
$234/Sq Ft
Est. Value
About This Home
This home is located at 7004 Fillmore Dr, Merrillville, IN 46410 and is currently estimated at $169,333, approximately $233 per square foot. 7004 Fillmore Dr is a home located in Lake County with nearby schools including Homer Iddings Elementary School, Merrillville Intermediate School, and Pierce Middle School.
Ownership History
Date
Name
Owned For
Owner Type
Purchase Details
Closed on
May 8, 2023
Sold by
Galante Melinda S
Bought by
Galante Rachel M
Current Estimated Value
Purchase Details
Closed on
May 2, 2023
Sold by
Galante Melinda S
Bought by
Galante Rachel M
Purchase Details
Closed on
Sep 7, 2019
Sold by
Mitchell Michael A
Bought by
Galante Melinda S
Purchase Details
Closed on
Jun 5, 2017
Sold by
Spradley Judy
Bought by
Mitchell Michaela M
Purchase Details
Closed on
Aug 21, 2014
Sold by
Chenoweth Mariorie C
Bought by
Spradley Judy
Purchase Details
Closed on
Sep 13, 2012
Sold by
Spradley Judith A and Chenoweth Marjorie C
Bought by
Bauer Roger A and Declaratio Donna
Purchase Details
Closed on
Sep 17, 2008
Sold by
Spradley Judith A and Chenoweth Marjorie C
Bought by
Spradely Judith A and Chenoweth Marjorie C
Create a Home Valuation Report for This Property
The Home Valuation Report is an in-depth analysis detailing your home's value as well as a comparison with similar homes in the area
Home Values in the Area
Average Home Value in this Area
Purchase History
| Date | Buyer | Sale Price | Title Company |
|---|---|---|---|
| Galante Rachel M | -- | None Listed On Document | |
| Galante Rachel M | -- | None Listed On Document | |
| Galante Melinda S | -- | None Available | |
| Mitchell Michaela M | -- | None Available | |
| Spradley Judy | -- | None Available | |
| Spradley Judy | -- | None Available | |
| Bauer Roger A | -- | Fidelity National Title Comp | |
| Bauer Roger A | -- | Multiple | |
| Spradely Judith A | -- | None Available | |
| Spradely Judith A | -- | None Available |
Source: Public Records
Tax History Compared to Growth
Tax History
| Year | Tax Paid | Tax Assessment Tax Assessment Total Assessment is a certain percentage of the fair market value that is determined by local assessors to be the total taxable value of land and additions on the property. | Land | Improvement |
|---|---|---|---|---|
| 2024 | $1,732 | $74,100 | $12,100 | $62,000 |
| 2023 | $1,232 | $73,900 | $11,900 | $62,000 |
| 2022 | $1,232 | $61,600 | $6,400 | $55,200 |
| 2021 | $1,082 | $54,100 | $5,900 | $48,200 |
| 2020 | $1,028 | $51,400 | $5,700 | $45,700 |
| 2019 | $2,075 | $50,600 | $5,500 | $45,100 |
| 2018 | $1,653 | $50,000 | $5,500 | $44,500 |
| 2017 | $1,227 | $49,800 | $5,500 | $44,300 |
| 2016 | $1,261 | $50,000 | $5,300 | $44,700 |
| 2014 | $1,135 | $53,400 | $5,900 | $47,500 |
| 2013 | $1,194 | $53,900 | $6,400 | $47,500 |
Source: Public Records
Map
Nearby Homes
- 7011 Tyler Ct
- 855 W 70th Place
- 6777 Polk St
- 7020 Harrison St
- 7064 Grant St
- 7105 Grant St
- 7084 Grant St
- 7125 Grant St
- 7127 Grant St
- 1136 W 72nd Cir
- 754 W 67th Ave
- 7195 Grant St
- 1519 W 72nd Place
- 7235 Grant St
- 7275 Grant St
- Grayson Plan at Savannah Cove
- Monterey Plan at Savannah Cove
- Fenwick Plan at Savannah Cove
- Camelia Plan at Savannah Cove
- Azalea Plan at Savannah Cove
- 7006 Fillmore Dr
- 7002 Fillmore Dr
- 7008 Fillmore Dr
- 7038 Fillmore Dr
- 7034 Fillmore Dr
- 7038 Fillmore Dr Unit 4
- 7010 Fillmore Dr
- 7010 Fillmore Dr
- 6996 Fillmore Dr
- 6990 Fillmore Dr
- 7014 Fillmore Dr
- 6986 Fillmore Dr
- 7018 Fillmore Dr
- 6982 Fillmore Dr
- 7022 Fillmore Dr Unit 3
- 7022 Fillmore Dr
- 7003 Fillmore Dr
- 7003 Fillmore Dr Unit 1
- 7005 Fillmore Dr Unit 2
- 7005 Fillmore Dr