7005 E 200 S Marion, IN 46953
Estimated Value: $139,000 - $166,811
3
Beds
1
Bath
1,224
Sq Ft
$129/Sq Ft
Est. Value
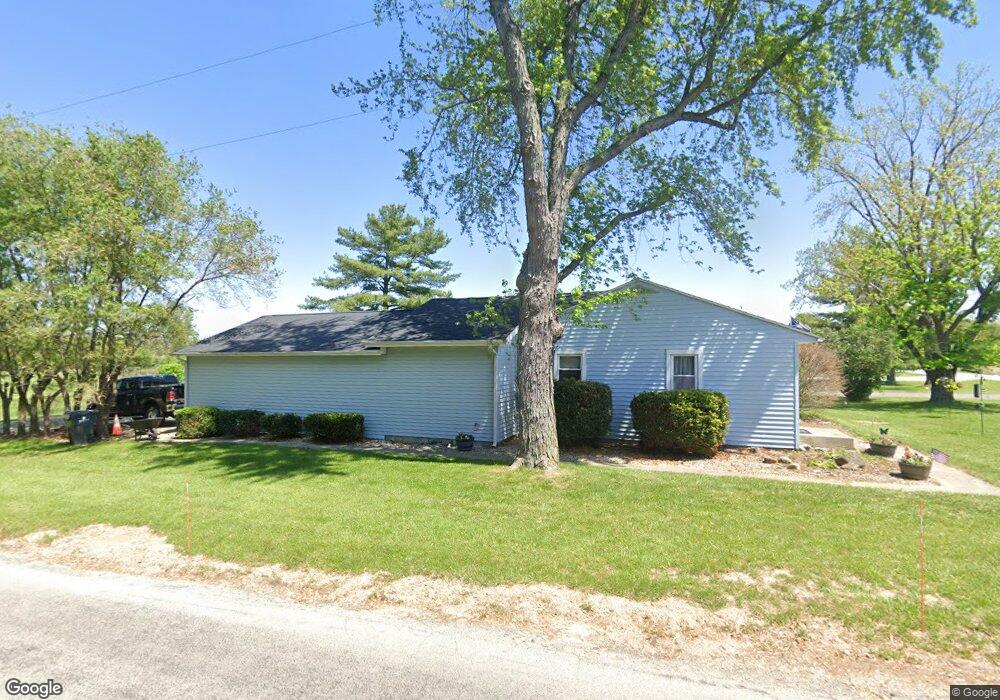
About This Home
This home is located at 7005 E 200 S, Marion, IN 46953 and is currently estimated at $157,953, approximately $129 per square foot. 7005 E 200 S is a home located in Grant County.
Ownership History
Date
Name
Owned For
Owner Type
Purchase Details
Closed on
Nov 4, 2022
Sold by
Moore Brenda K
Bought by
Lambert James
Current Estimated Value
Home Financials for this Owner
Home Financials are based on the most recent Mortgage that was taken out on this home.
Original Mortgage
$99,000
Interest Rate
6.94%
Mortgage Type
New Conventional
Purchase Details
Closed on
May 28, 2008
Sold by
Runyan Steven M
Bought by
Dell Mark R and Dell Brenda K
Home Financials for this Owner
Home Financials are based on the most recent Mortgage that was taken out on this home.
Original Mortgage
$75,591
Interest Rate
6.09%
Mortgage Type
VA
Purchase Details
Closed on
Aug 28, 2002
Sold by
Not Provided
Bought by
Not Provided
Create a Home Valuation Report for This Property
The Home Valuation Report is an in-depth analysis detailing your home's value as well as a comparison with similar homes in the area
Purchase History
| Date | Buyer | Sale Price | Title Company |
|---|---|---|---|
| Lambert James | -- | -- | |
| Dell Mark R | -- | None Available | |
| Not Provided | $67,900 | -- |
Source: Public Records
Mortgage History
| Date | Status | Borrower | Loan Amount |
|---|---|---|---|
| Previous Owner | Lambert James | $99,000 | |
| Previous Owner | Dell Mark R | $75,591 |
Source: Public Records
Tax History
| Year | Tax Paid | Tax Assessment Tax Assessment Total Assessment is a certain percentage of the fair market value that is determined by local assessors to be the total taxable value of land and additions on the property. | Land | Improvement |
|---|---|---|---|---|
| 2025 | $576 | $143,400 | $12,500 | $130,900 |
| 2024 | $576 | $128,100 | $12,500 | $115,600 |
| 2023 | $460 | $114,200 | $12,500 | $101,700 |
| 2022 | $349 | $93,100 | $9,700 | $83,400 |
| 2021 | $307 | $86,100 | $9,700 | $76,400 |
| 2020 | $250 | $81,600 | $9,200 | $72,400 |
| 2019 | $248 | $83,300 | $9,200 | $74,100 |
| 2018 | $209 | $80,200 | $9,200 | $71,000 |
| 2017 | $191 | $79,400 | $9,200 | $70,200 |
| 2016 | $181 | $79,400 | $9,200 | $70,200 |
| 2014 | $143 | $74,800 | $9,200 | $65,600 |
| 2013 | $143 | $64,800 | $9,200 | $55,600 |
Source: Public Records
Map
Nearby Homes
- 1864 S 700 E
- 0 E 200 S Unit 202601439
- 6004 E 200 S
- 1270 S 600 E
- 300 E S
- 8219 E 100 S
- 4432 E 200 S
- 0 County Road 425 S
- 66 Cobblestone Blvd
- 1205 Trace Ave
- 1207 Trace Ave
- 9810 E 400 S
- 14 Cobblestone Blvd
- 0 S 500 E Unit 202537350
- 6231 E 600 S
- 521 E North A St
- 515 E North A St
- 614 E South A St
- Lot 8 W South St
- Lot 7 W South St
Your Personal Tour Guide
Ask me questions while you tour the home.