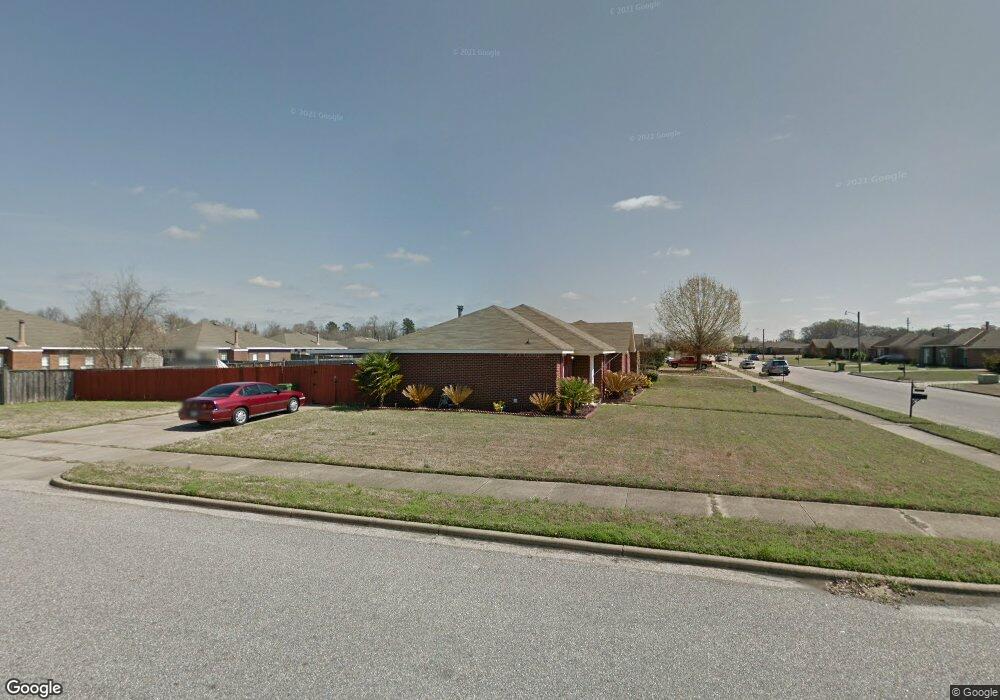
7005 Eastern Shore Rd Montgomery, AL 36117
East Montgomery NeighborhoodEstimated Value: $161,359 - $185,000
3
Beds
2
Baths
1,357
Sq Ft
$129/Sq Ft
Est. Value
About This Home
This home is located at 7005 Eastern Shore Rd, Montgomery, AL 36117 and is currently estimated at $174,590, approximately $128 per square foot. 7005 Eastern Shore Rd is a home located in Montgomery County with nearby schools including William Silas Garrett Elementary School, Goodwyn Middle School, and Dr. Percy L. Julian High School.
Ownership History
Date
Name
Owned For
Owner Type
Purchase Details
Closed on
Feb 9, 2009
Sold by
Smith Nicholas R and Smith Lorry J
Bought by
Mitchell Tiffany and Mitchell Randy
Current Estimated Value
Home Financials for this Owner
Home Financials are based on the most recent Mortgage that was taken out on this home.
Original Mortgage
$123,717
Outstanding Balance
$78,120
Interest Rate
5.08%
Mortgage Type
FHA
Estimated Equity
$96,470
Purchase Details
Closed on
Nov 16, 2004
Sold by
Wynn John Paul and Wynn Mary M
Bought by
Smith Nicholas R and Smith Lorry J
Home Financials for this Owner
Home Financials are based on the most recent Mortgage that was taken out on this home.
Original Mortgage
$109,300
Interest Rate
5.66%
Mortgage Type
Purchase Money Mortgage
Purchase Details
Closed on
May 17, 1999
Sold by
Watts Development Company Inc
Bought by
Wynn John Paul and Mattingly Mary M
Home Financials for this Owner
Home Financials are based on the most recent Mortgage that was taken out on this home.
Original Mortgage
$96,207
Interest Rate
6.98%
Mortgage Type
FHA
Create a Home Valuation Report for This Property
The Home Valuation Report is an in-depth analysis detailing your home's value as well as a comparison with similar homes in the area
Home Values in the Area
Average Home Value in this Area
Purchase History
| Date | Buyer | Sale Price | Title Company |
|---|---|---|---|
| Mitchell Tiffany | $126,217 | None Available | |
| Smith Nicholas R | -- | -- | |
| Wynn John Paul | -- | -- |
Source: Public Records
Mortgage History
| Date | Status | Borrower | Loan Amount |
|---|---|---|---|
| Open | Mitchell Tiffany | $123,717 | |
| Closed | Smith Nicholas R | $109,300 | |
| Closed | Wynn John Paul | $96,207 |
Source: Public Records
Tax History
| Year | Tax Paid | Tax Assessment Tax Assessment Total Assessment is a certain percentage of the fair market value that is determined by local assessors to be the total taxable value of land and additions on the property. | Land | Improvement |
|---|---|---|---|---|
| 2025 | $648 | $13,990 | $2,500 | $11,490 |
| 2024 | $719 | $15,450 | $2,500 | $12,950 |
| 2023 | $719 | $14,670 | $2,500 | $12,170 |
| 2022 | $409 | $12,320 | $2,500 | $9,820 |
| 2021 | $374 | $11,360 | $0 | $0 |
| 2020 | $378 | $11,470 | $2,500 | $8,970 |
| 2019 | $362 | $11,030 | $2,500 | $8,530 |
| 2018 | $407 | $11,140 | $2,500 | $8,640 |
| 2017 | $334 | $20,560 | $5,000 | $15,560 |
| 2014 | $366 | $11,130 | $2,500 | $8,630 |
| 2013 | -- | $11,270 | $2,000 | $9,270 |
Source: Public Records
Map
Nearby Homes
- 6966 Oak Side Dr
- 7029 Oak Side Dr
- 920 Countryside Ln
- 6520 Morning Glory Ct
- 6742 Overview Dr
- 1029 Juniper Ct
- 6520 Pinebrook Dr
- 6265 Wares Ferry Rd
- 6427 Pinebrook Dr
- 6408 Pinebrook Dr
- 6439 Yates Ct
- 7282 Greenfield Rd
- 6820 Canter Trail
- 7100 Buckram Oak Dr
- 6625 Rock Ledge Rd
- 501 Red Oak Ct
- 148 Blushing Groom St
- 7249 Waters Edge
- 7331 Orange Blossom Way
- 317 Brownwood Ct
- 7009 Eastern Shore Rd
- 7013 Eastern Shore Rd
- 7000 Oak Side Dr
- 7008 Eastern Shore Rd
- 6977 Eastern Shore Rd
- 7004 Eastern Shore Rd
- 7004 Oak Side Dr
- 7000 Eastern Shore Rd
- 7012 Eastern Shore Rd
- 7017 Eastern Shore Rd
- 7008 Oak Side Dr
- 6978 Oak Side Dr
- 6976 Eastern Shore Rd
- 6973 Eastern Shore Rd
- 7016 Eastern Shore Rd
- 7012 Oak Side Dr
- 7021 Eastern Shore Rd
- 6974 Oak Side Dr
- 6972 Eastern Shore Rd
- 7020 Eastern Shore Rd
Your Personal Tour Guide
Ask me questions while you tour the home.